 (2)
(2)The range
of a set of values is the difference between extreme values (highest and lowest)
plus 1. The range of series S
= (10 - 4 + 1) = 7.
Variance is a measure of the
dispersion a set of values. The variance
of a population (σ2)
is defined as
(2)
where N
is the number of members of the population, μ
is the mean value, and Xi
is the value of the ith member.
The variance of a sample (s2)
is defined as
 (3)
(3)
where
X-bar (X with the line over it) is the mean of the sample, and n
is the number of values in the sample.
It is my understanding that a "population" involves all (for
example, all residents of
Random errors scattered about a mean frequently exhibit a normal distribution. There
are more values close to the mean than far from the median.
A normal distribution describes data or measurements that are consistent
with the equation
 (4)
(4)
where u
is the value of the function, μ is the mean (equation 1), and σ is the standard
deviation (equation 5 or equation 6).
 (5)
(5)
 (6)
(6)
Of course, s replaces σ when characterizing a sample
rather than a population.
Equation 4 describes the bell
curve, the graph consistent with a normal distribution.
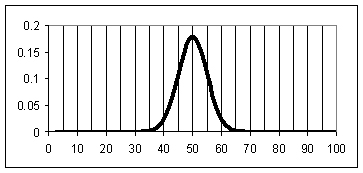
Figure 1: bell curve for mean = 50 and
standard deviation = 5.0.
Figure 1 is an example of a bell curve.
Compare Figure 1 with Figure 2, a distribution with the same mean but a
larger standard deviation.
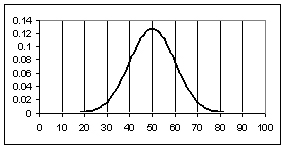
Figure
2:
The area
under a segment the bell curve represents the percentage of a population or
sample that falls within the range of that segment.
The area between the mean and one standard deviation above or below the
mean equals 34.13% of the total area. The
area between the mean and two standard deviations equals 47.72%, and the area
between the mean and three standard deviations equals 49.87%.
Given a set
of measurements subject to random error, the standard deviation provides a
measure of the confidence we might have that the "true" value lies
within a certain range. Confidence
is 68% that the true value lies within 1 standard deviation of the mean (in
Figure 2, between the values 40 and 60). Confidence
is 95% that the true value lies within 2 standard deviations (between 30 and 70
in Figure 2) and 99% that it lies within 3 standard deviations (between 20 and
80).
Most "scientific" calculators have built-in statistical functions. You will probably have to locate the manual and look up the procedure for entering data and accessing the results (mean, standard deviation).