Figures for The Geology of the Virginia Coast
Click on the thumbnail image to view the full-size figure. Right click and use Save As to download the image.
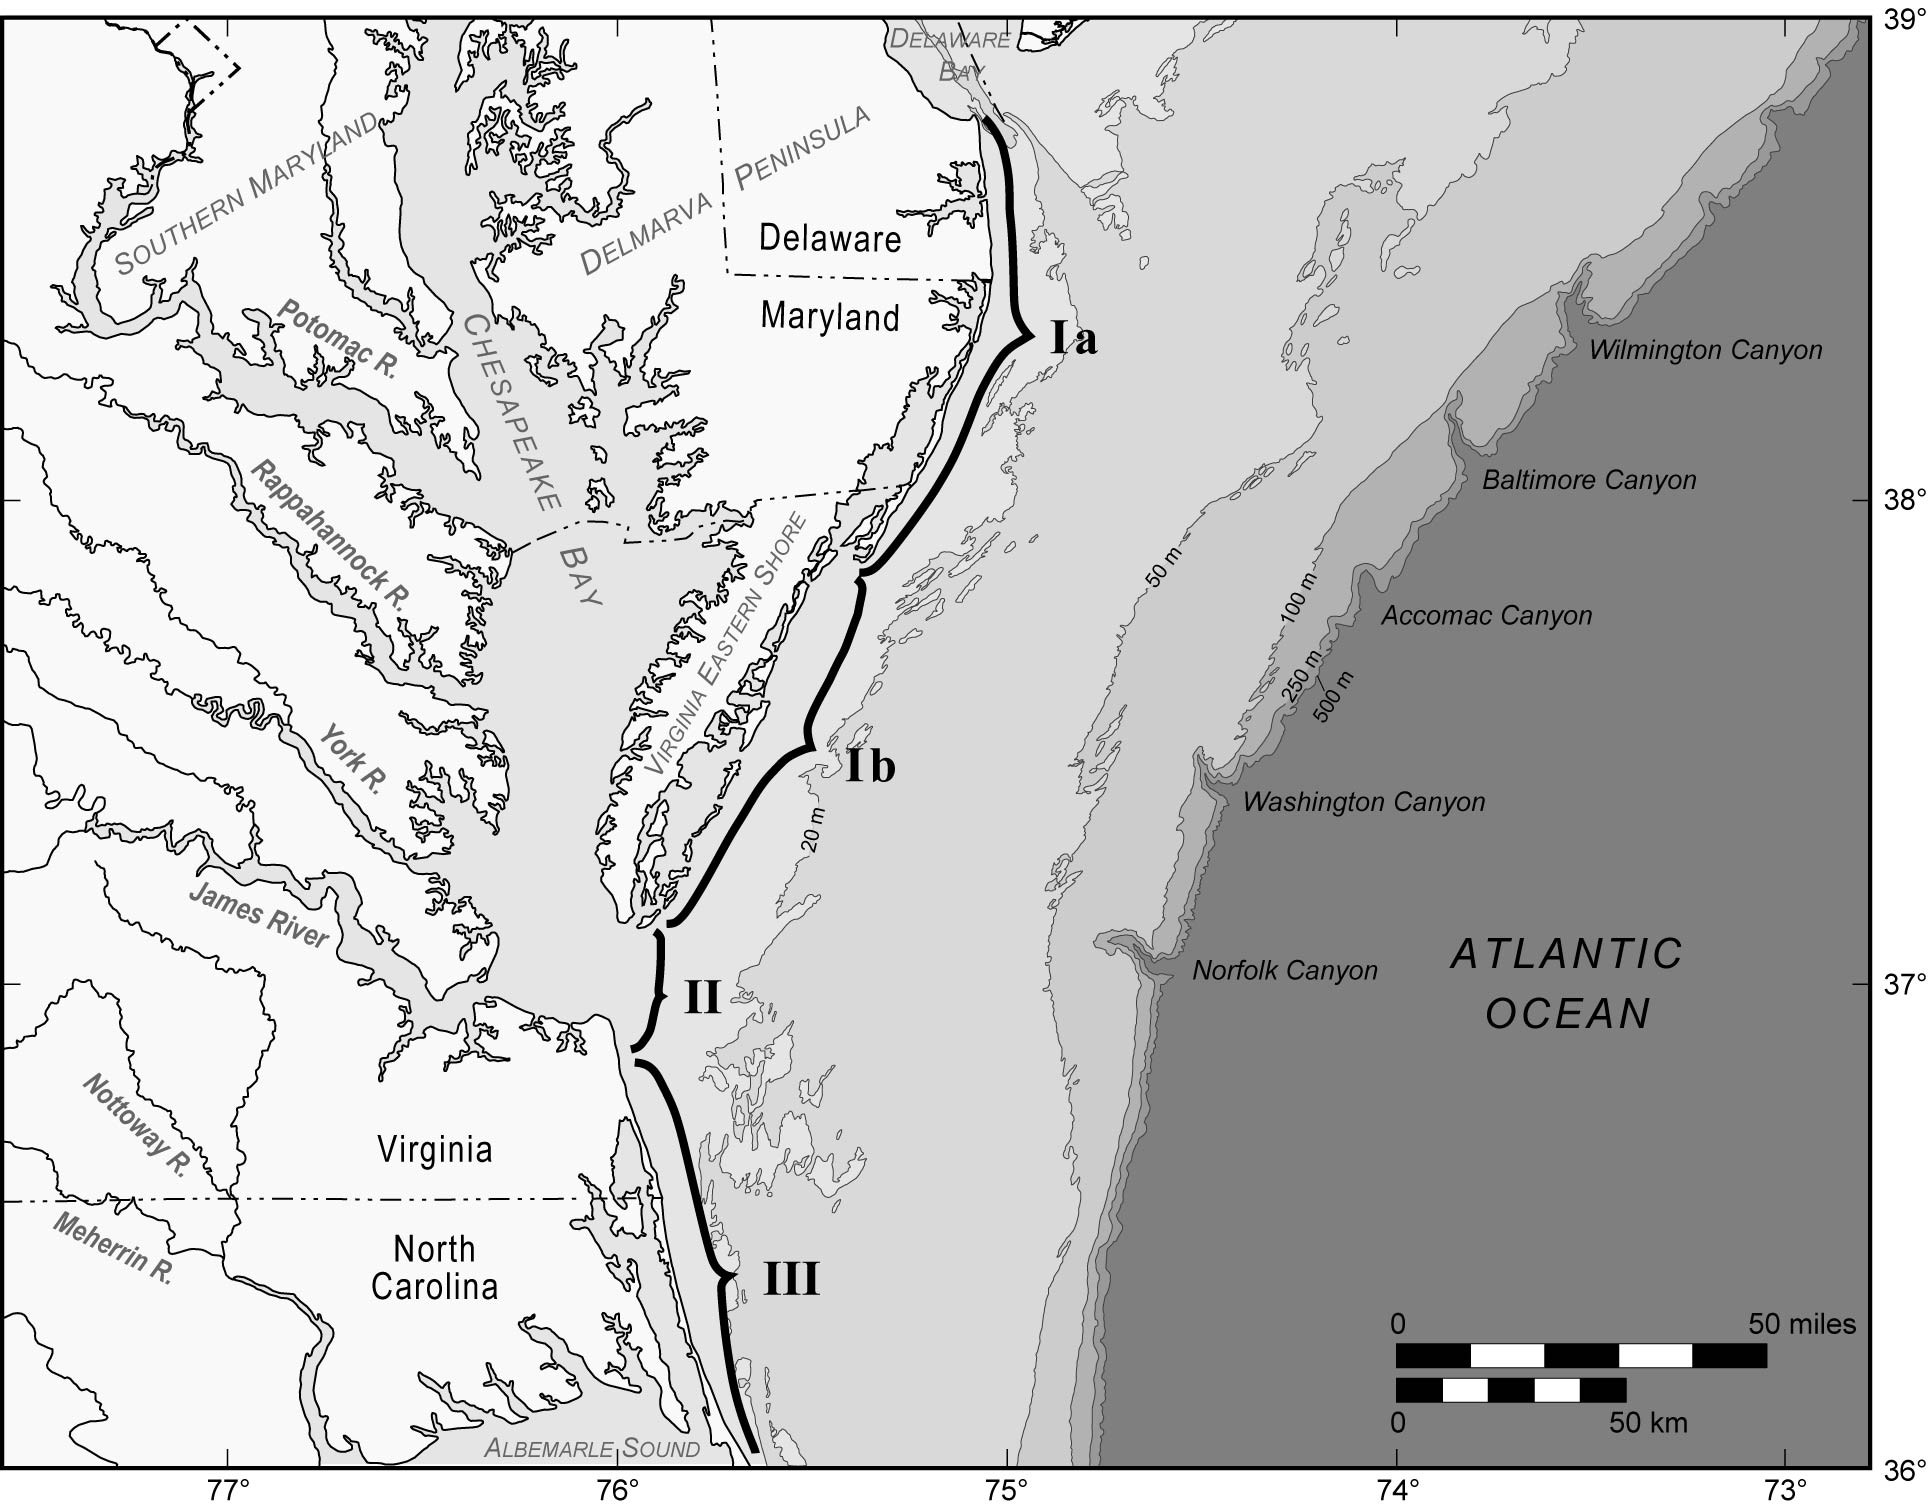
Figure 1: The Virginia coastal zone can be divided by geologic character into three broad geographic areas: the Atlantic coast of the Delmarva Peninsula, the mouth of Chesapeake Bay, and the mainland shore of southeastern Virginia continuing into northeastern North Carolina.
Figure 2: Weight percent sand from 380 samples offshore of southeastern Virginia (Hobbs, 1997).
Figure 3: Extension of southern Delmarva as a large-scale prograding spit, also showing the paleochannels of the Susquehanna River (Hobbs, 2004).
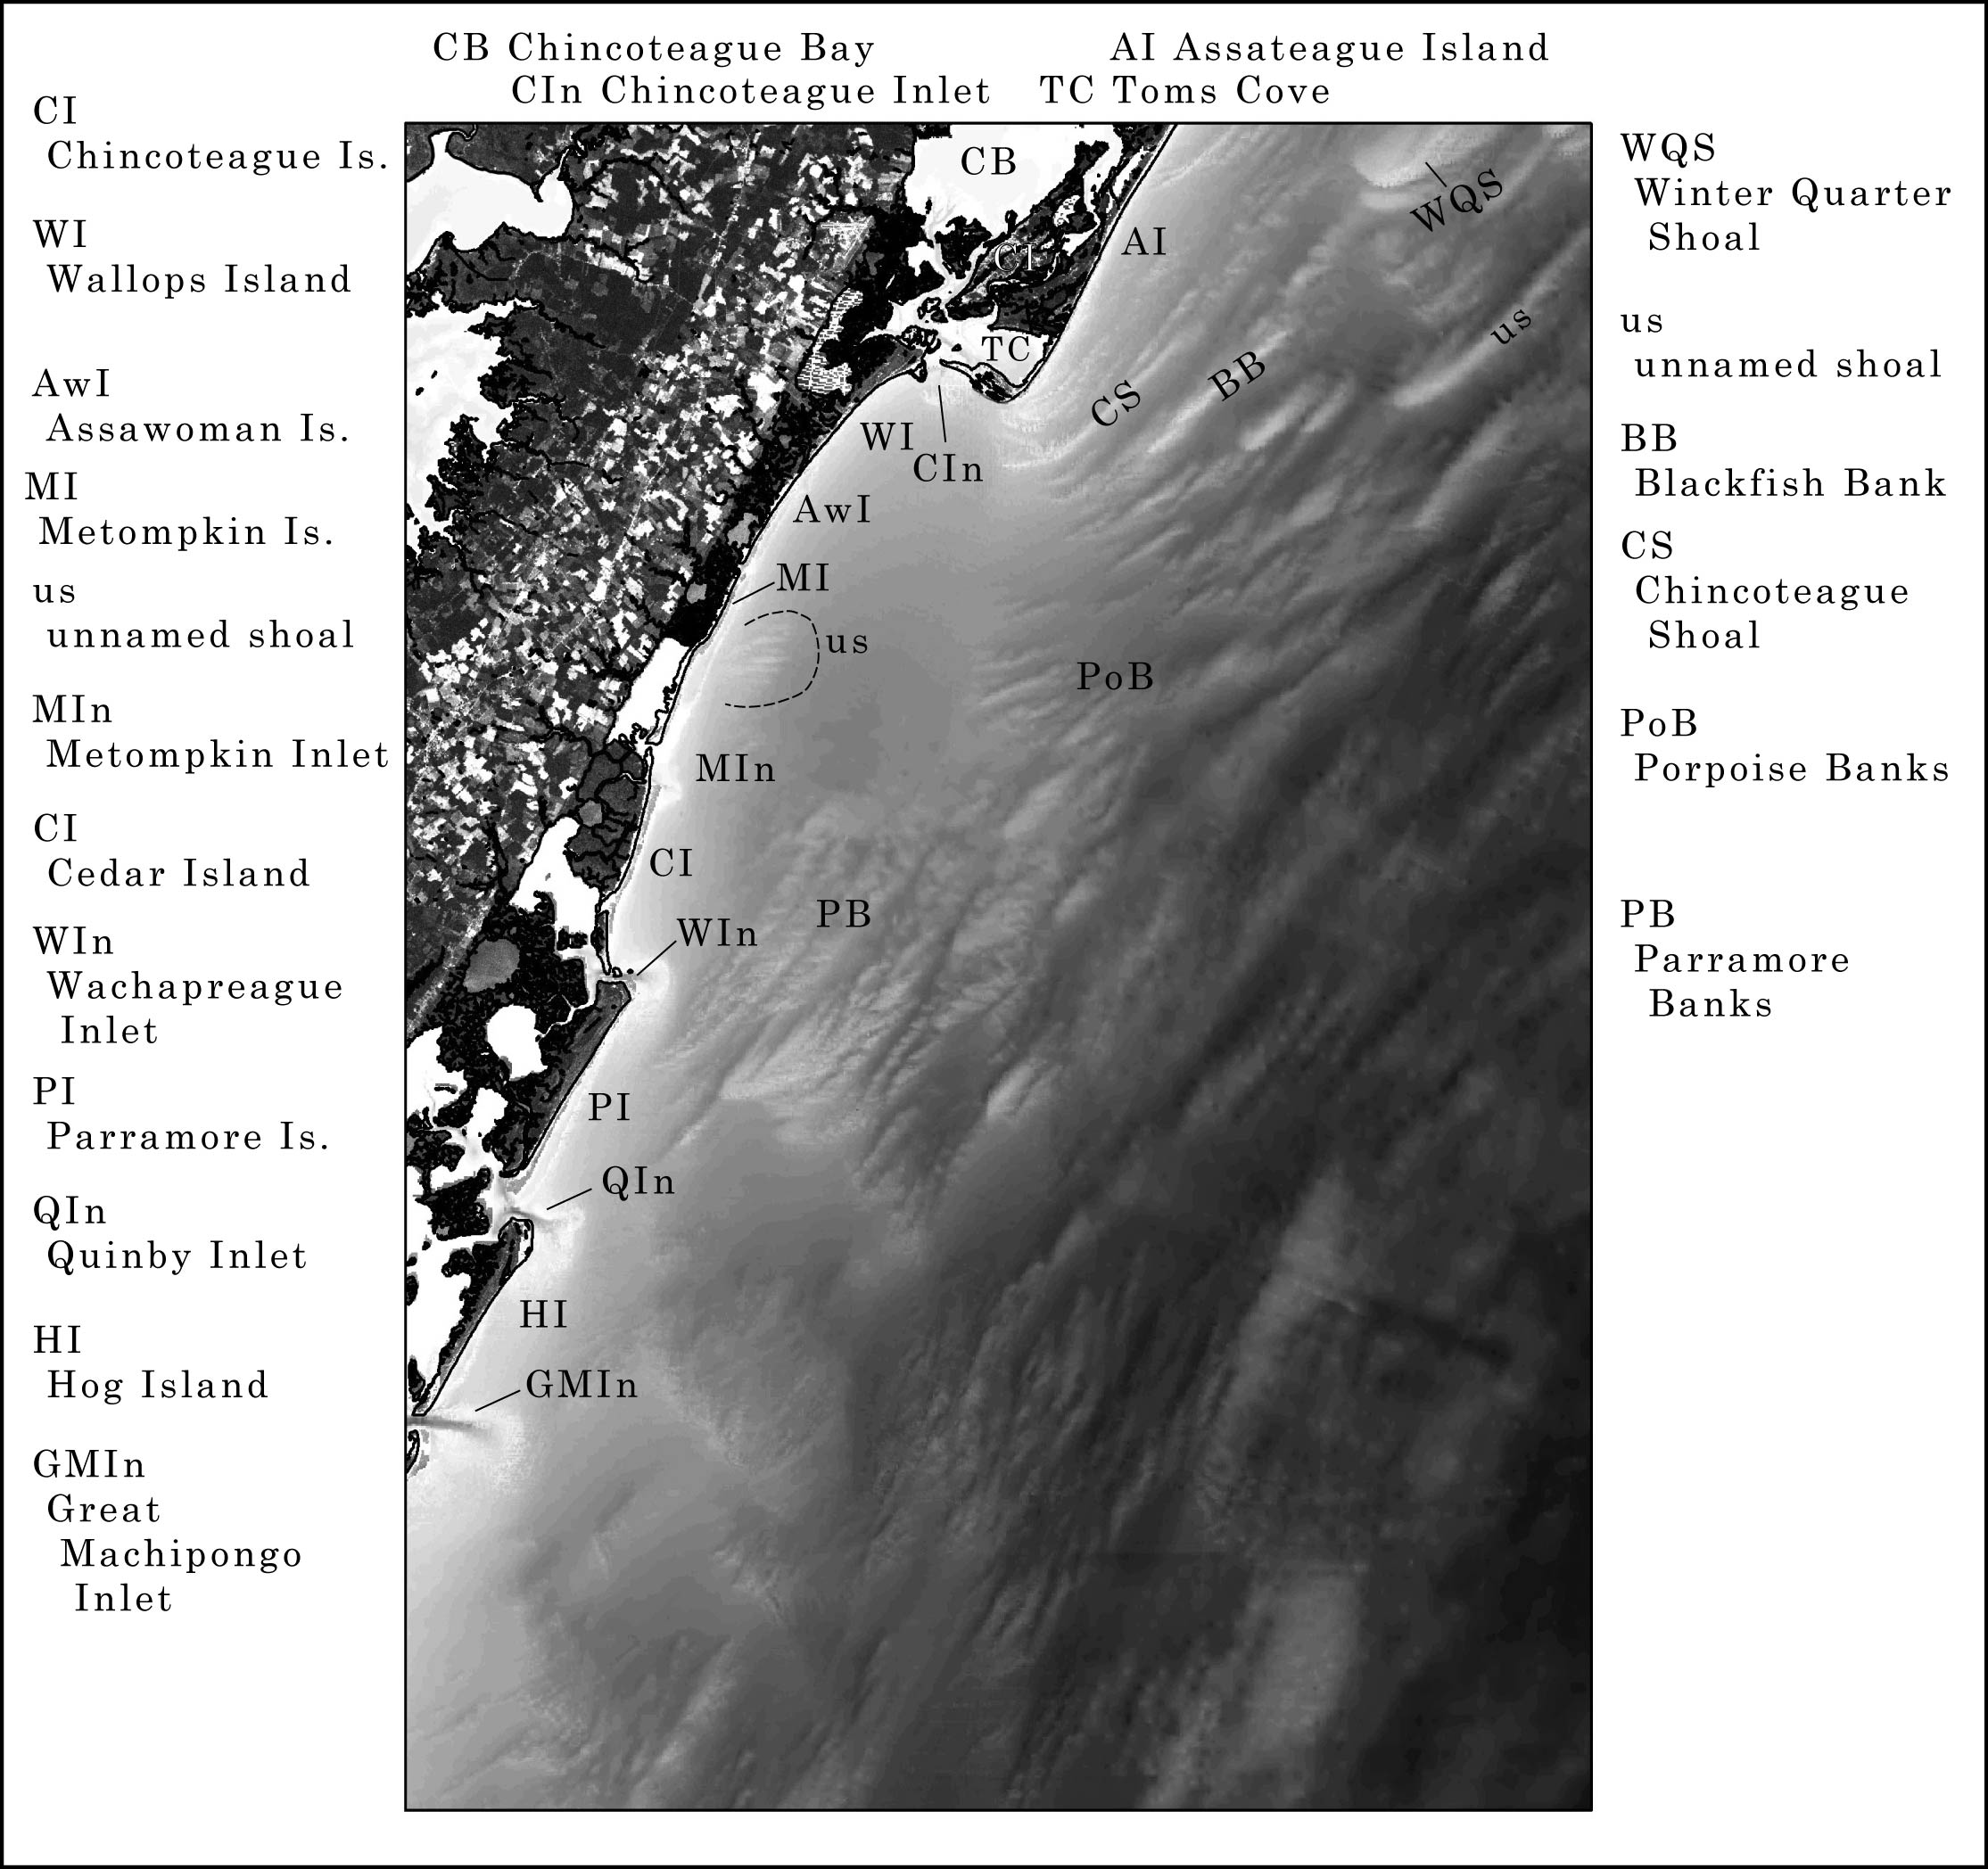
Figure 4: Coastal zone and shaded-relief bathymetry of the inner shelf for the Delmarva coast from southern Assateague Island to Hog Island, showing the landward offset of barrier islands forming the Chincoteague Bight.
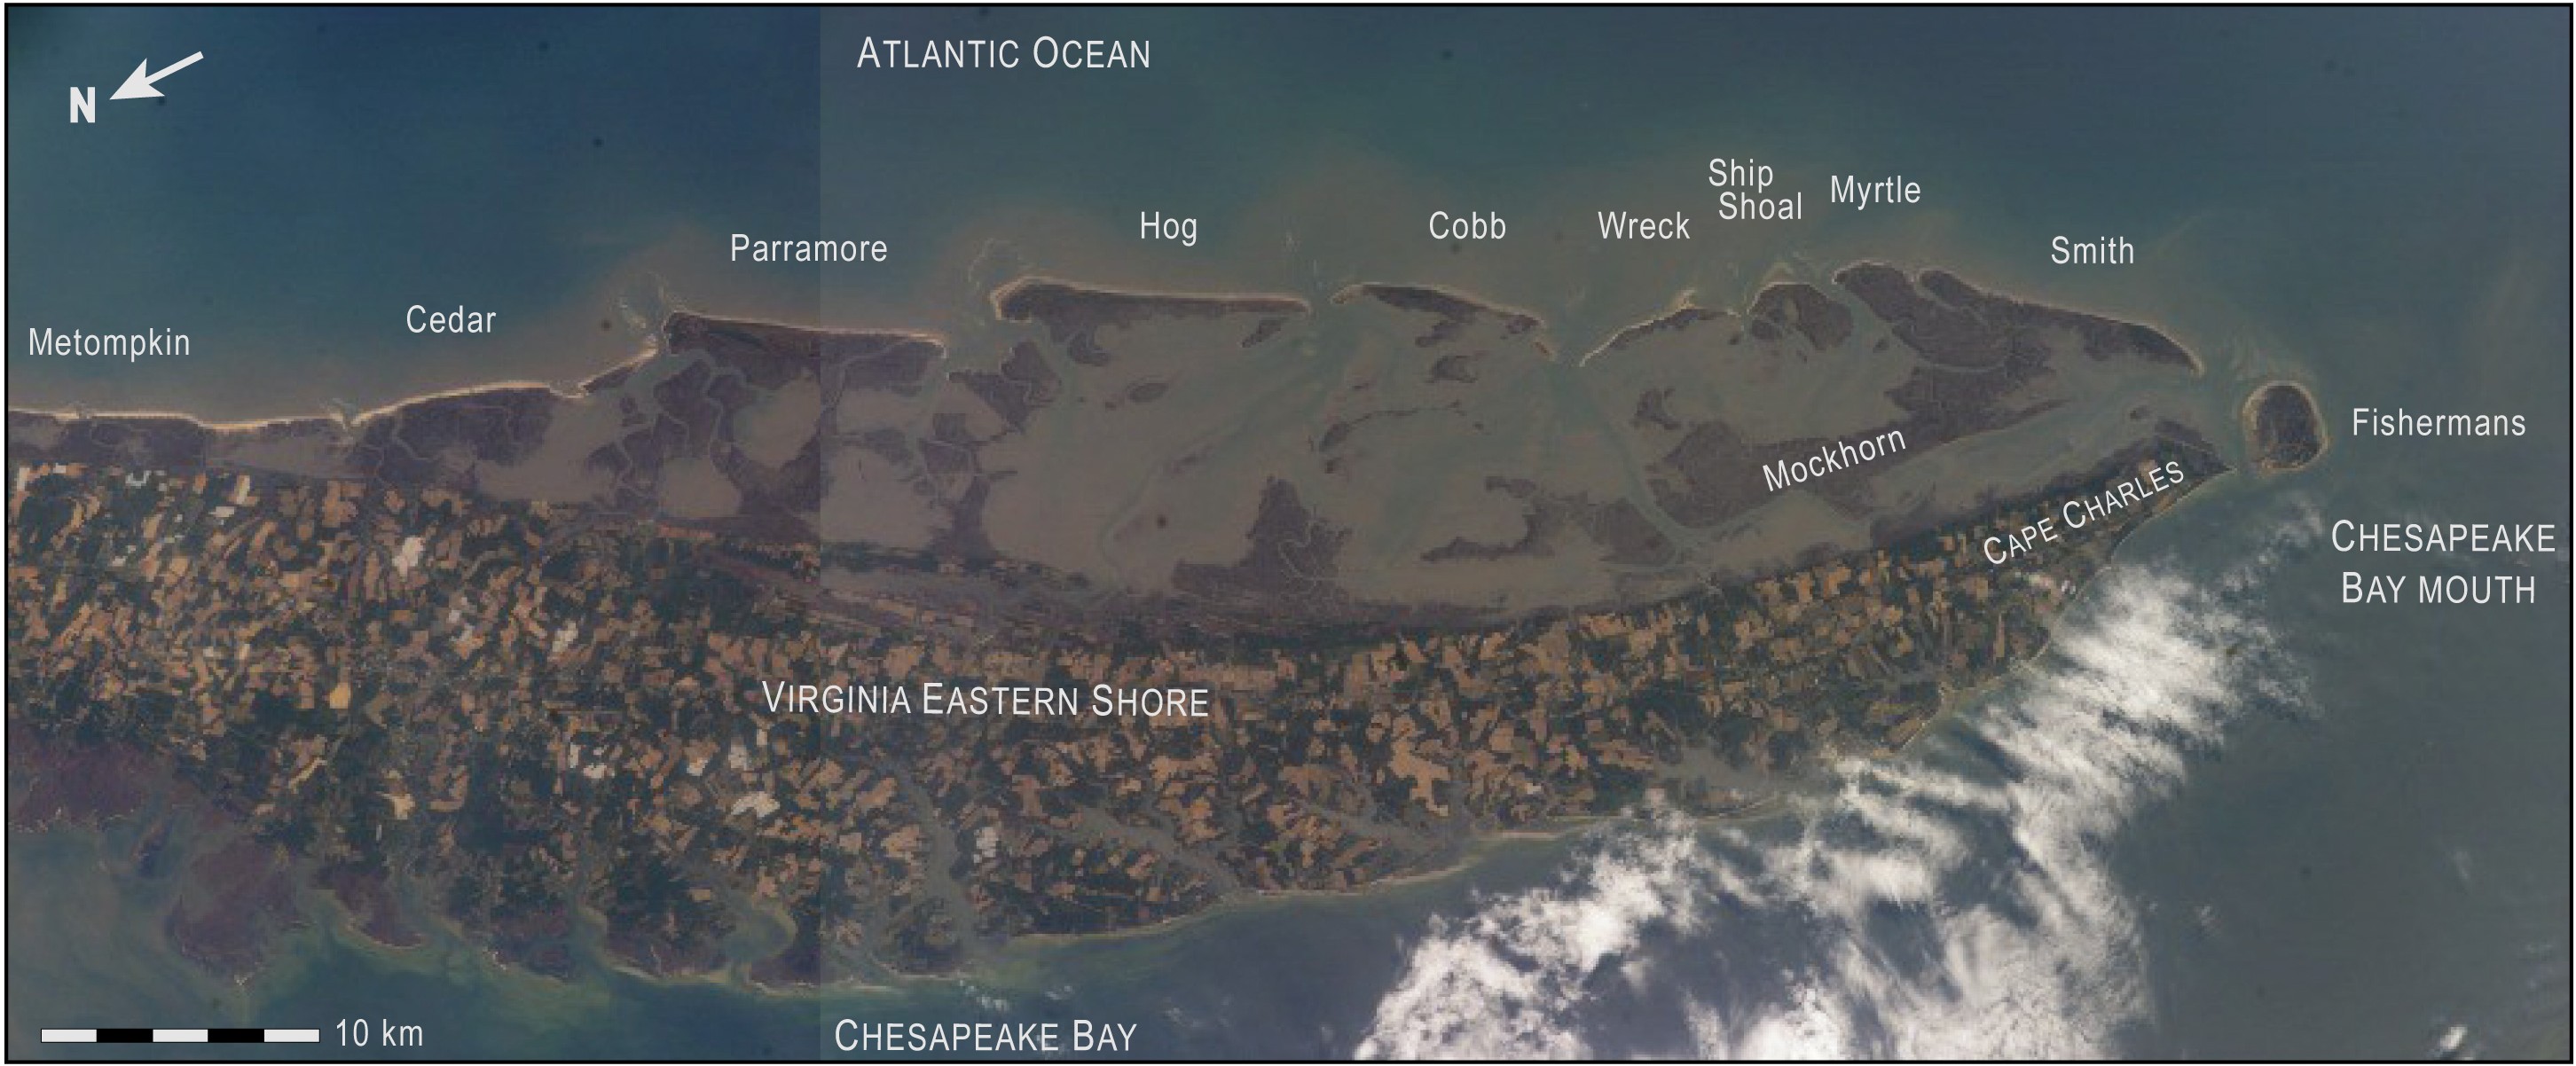
Figure 5: Mosaic of the Virginia Eastern Shore from photos taken from the International Space Station. (NASA images ISS004-E-11554 and 11555.)
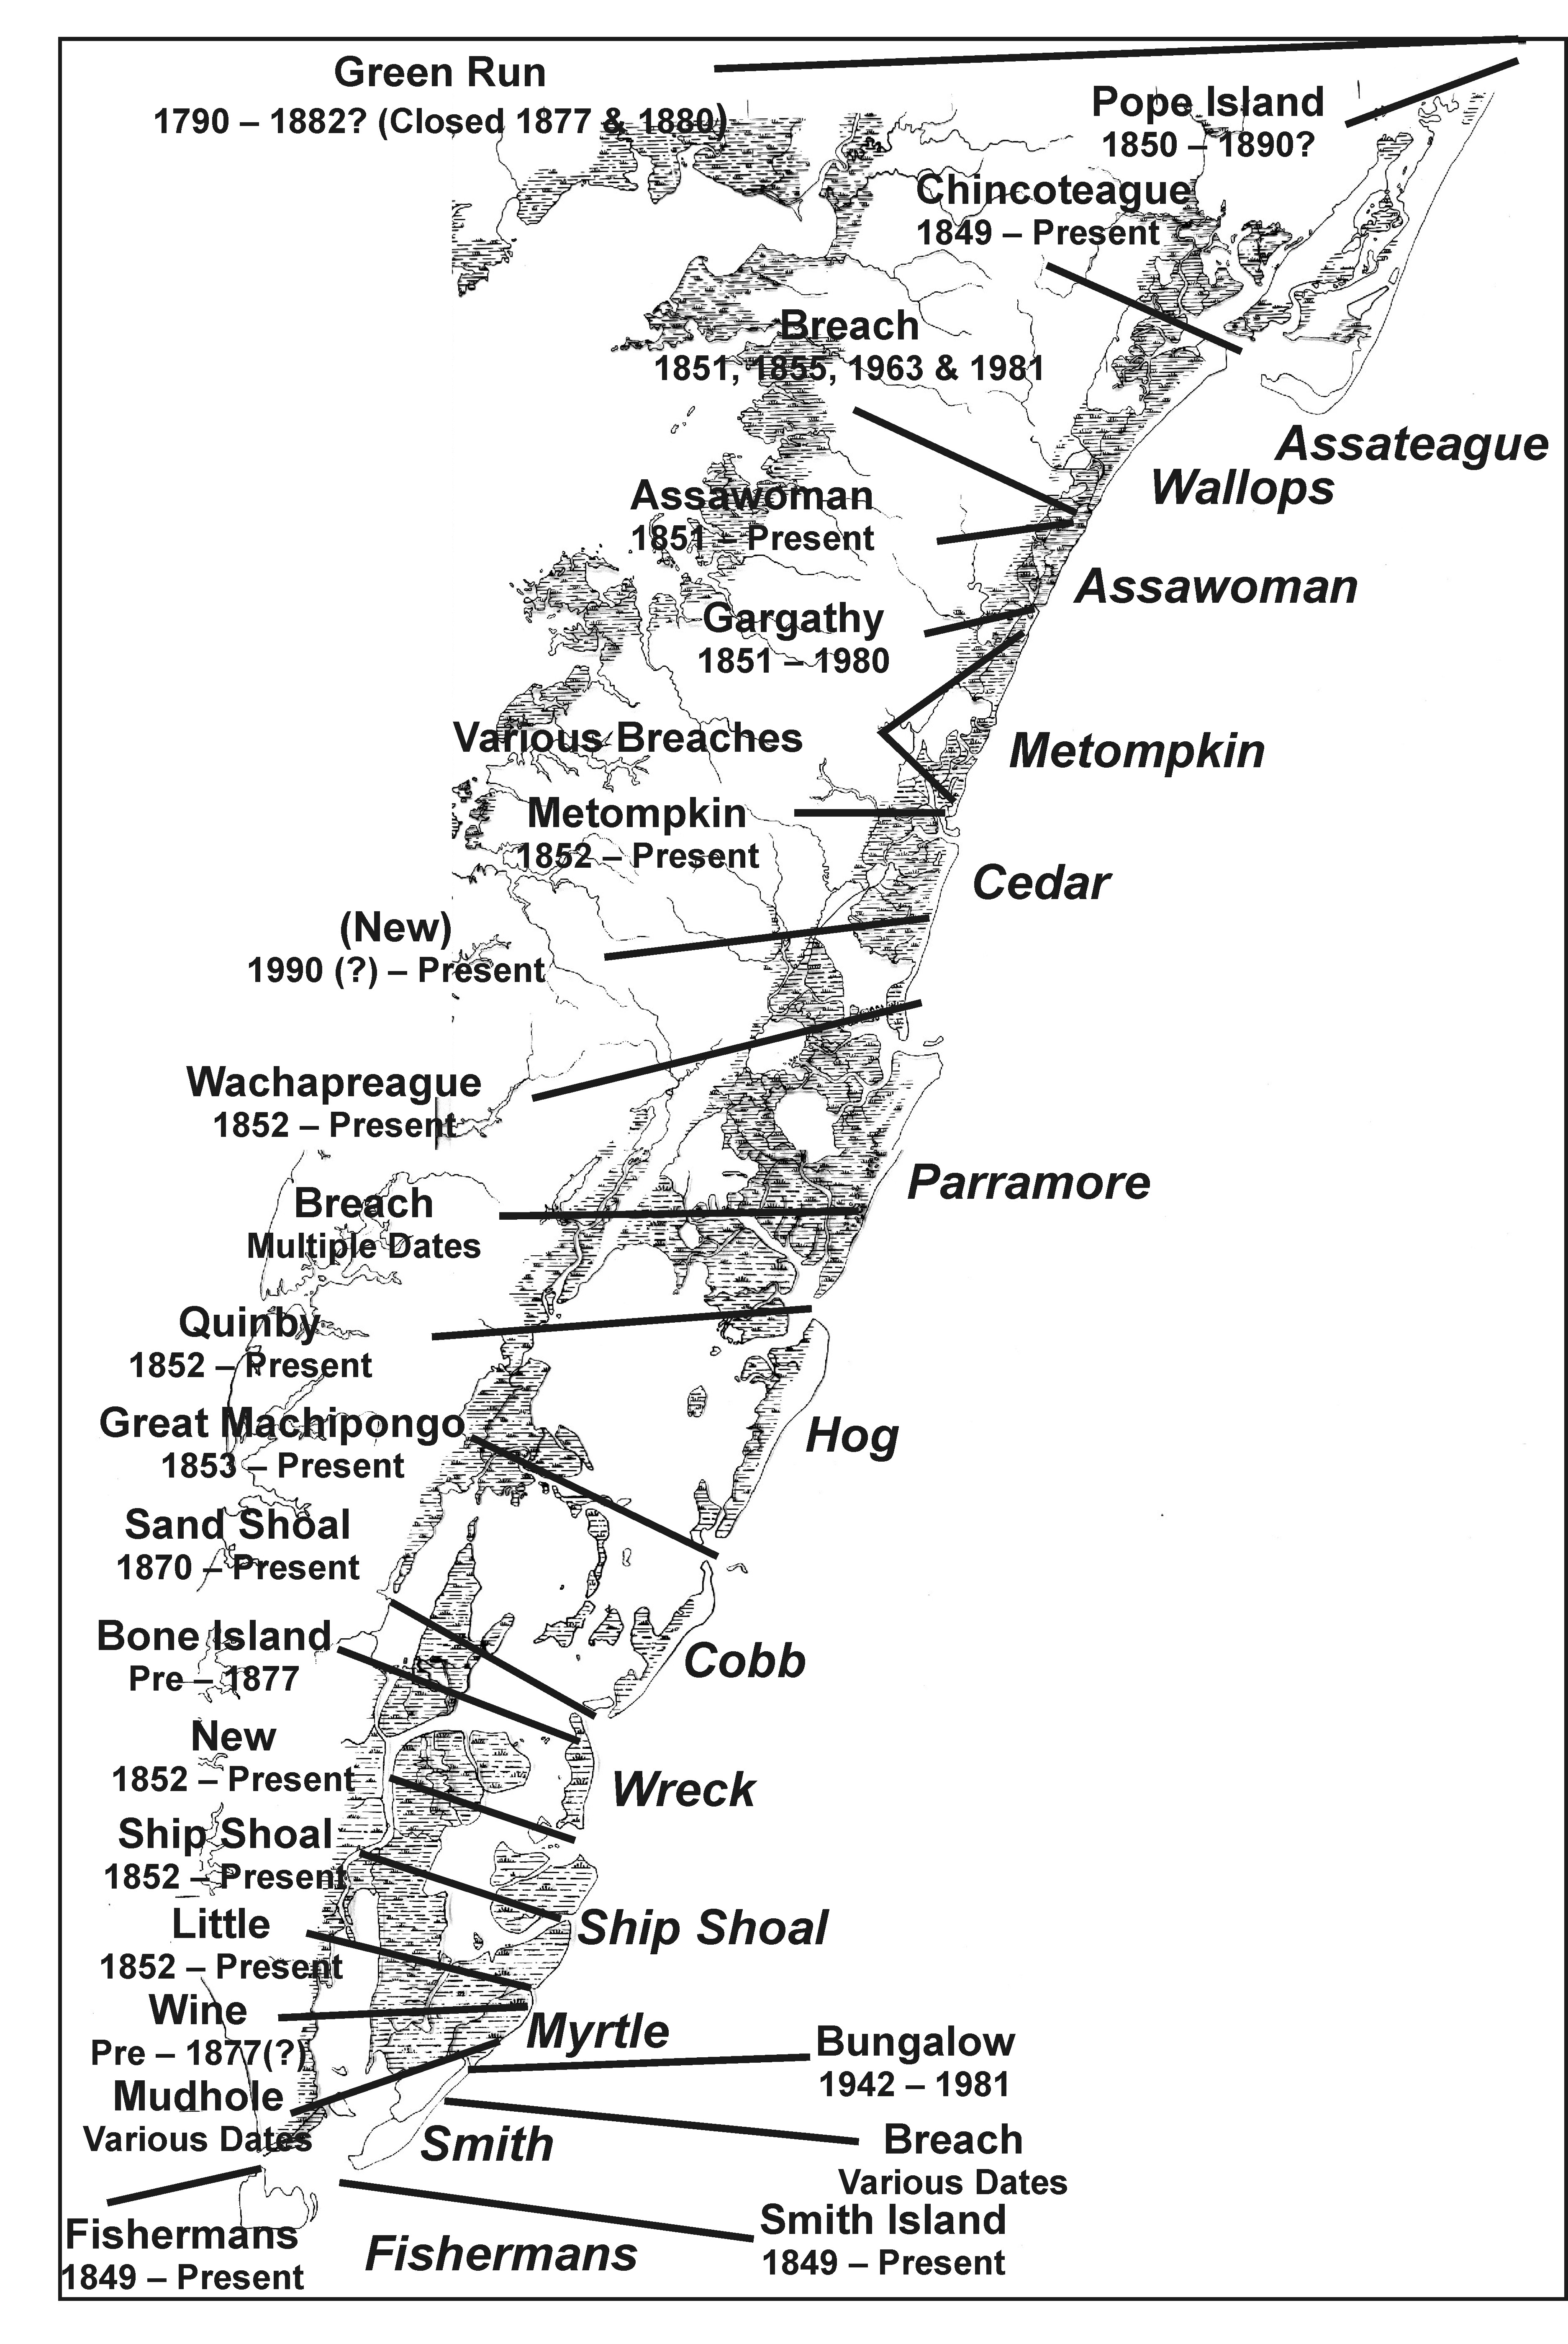
Figure 6: Location of present and historic inlets in the Virginia barrier island chain. Initial dates refer to dates of the first chart on which inlet was named. Names of barrier islands are in italics. Modified from McBride (1999).
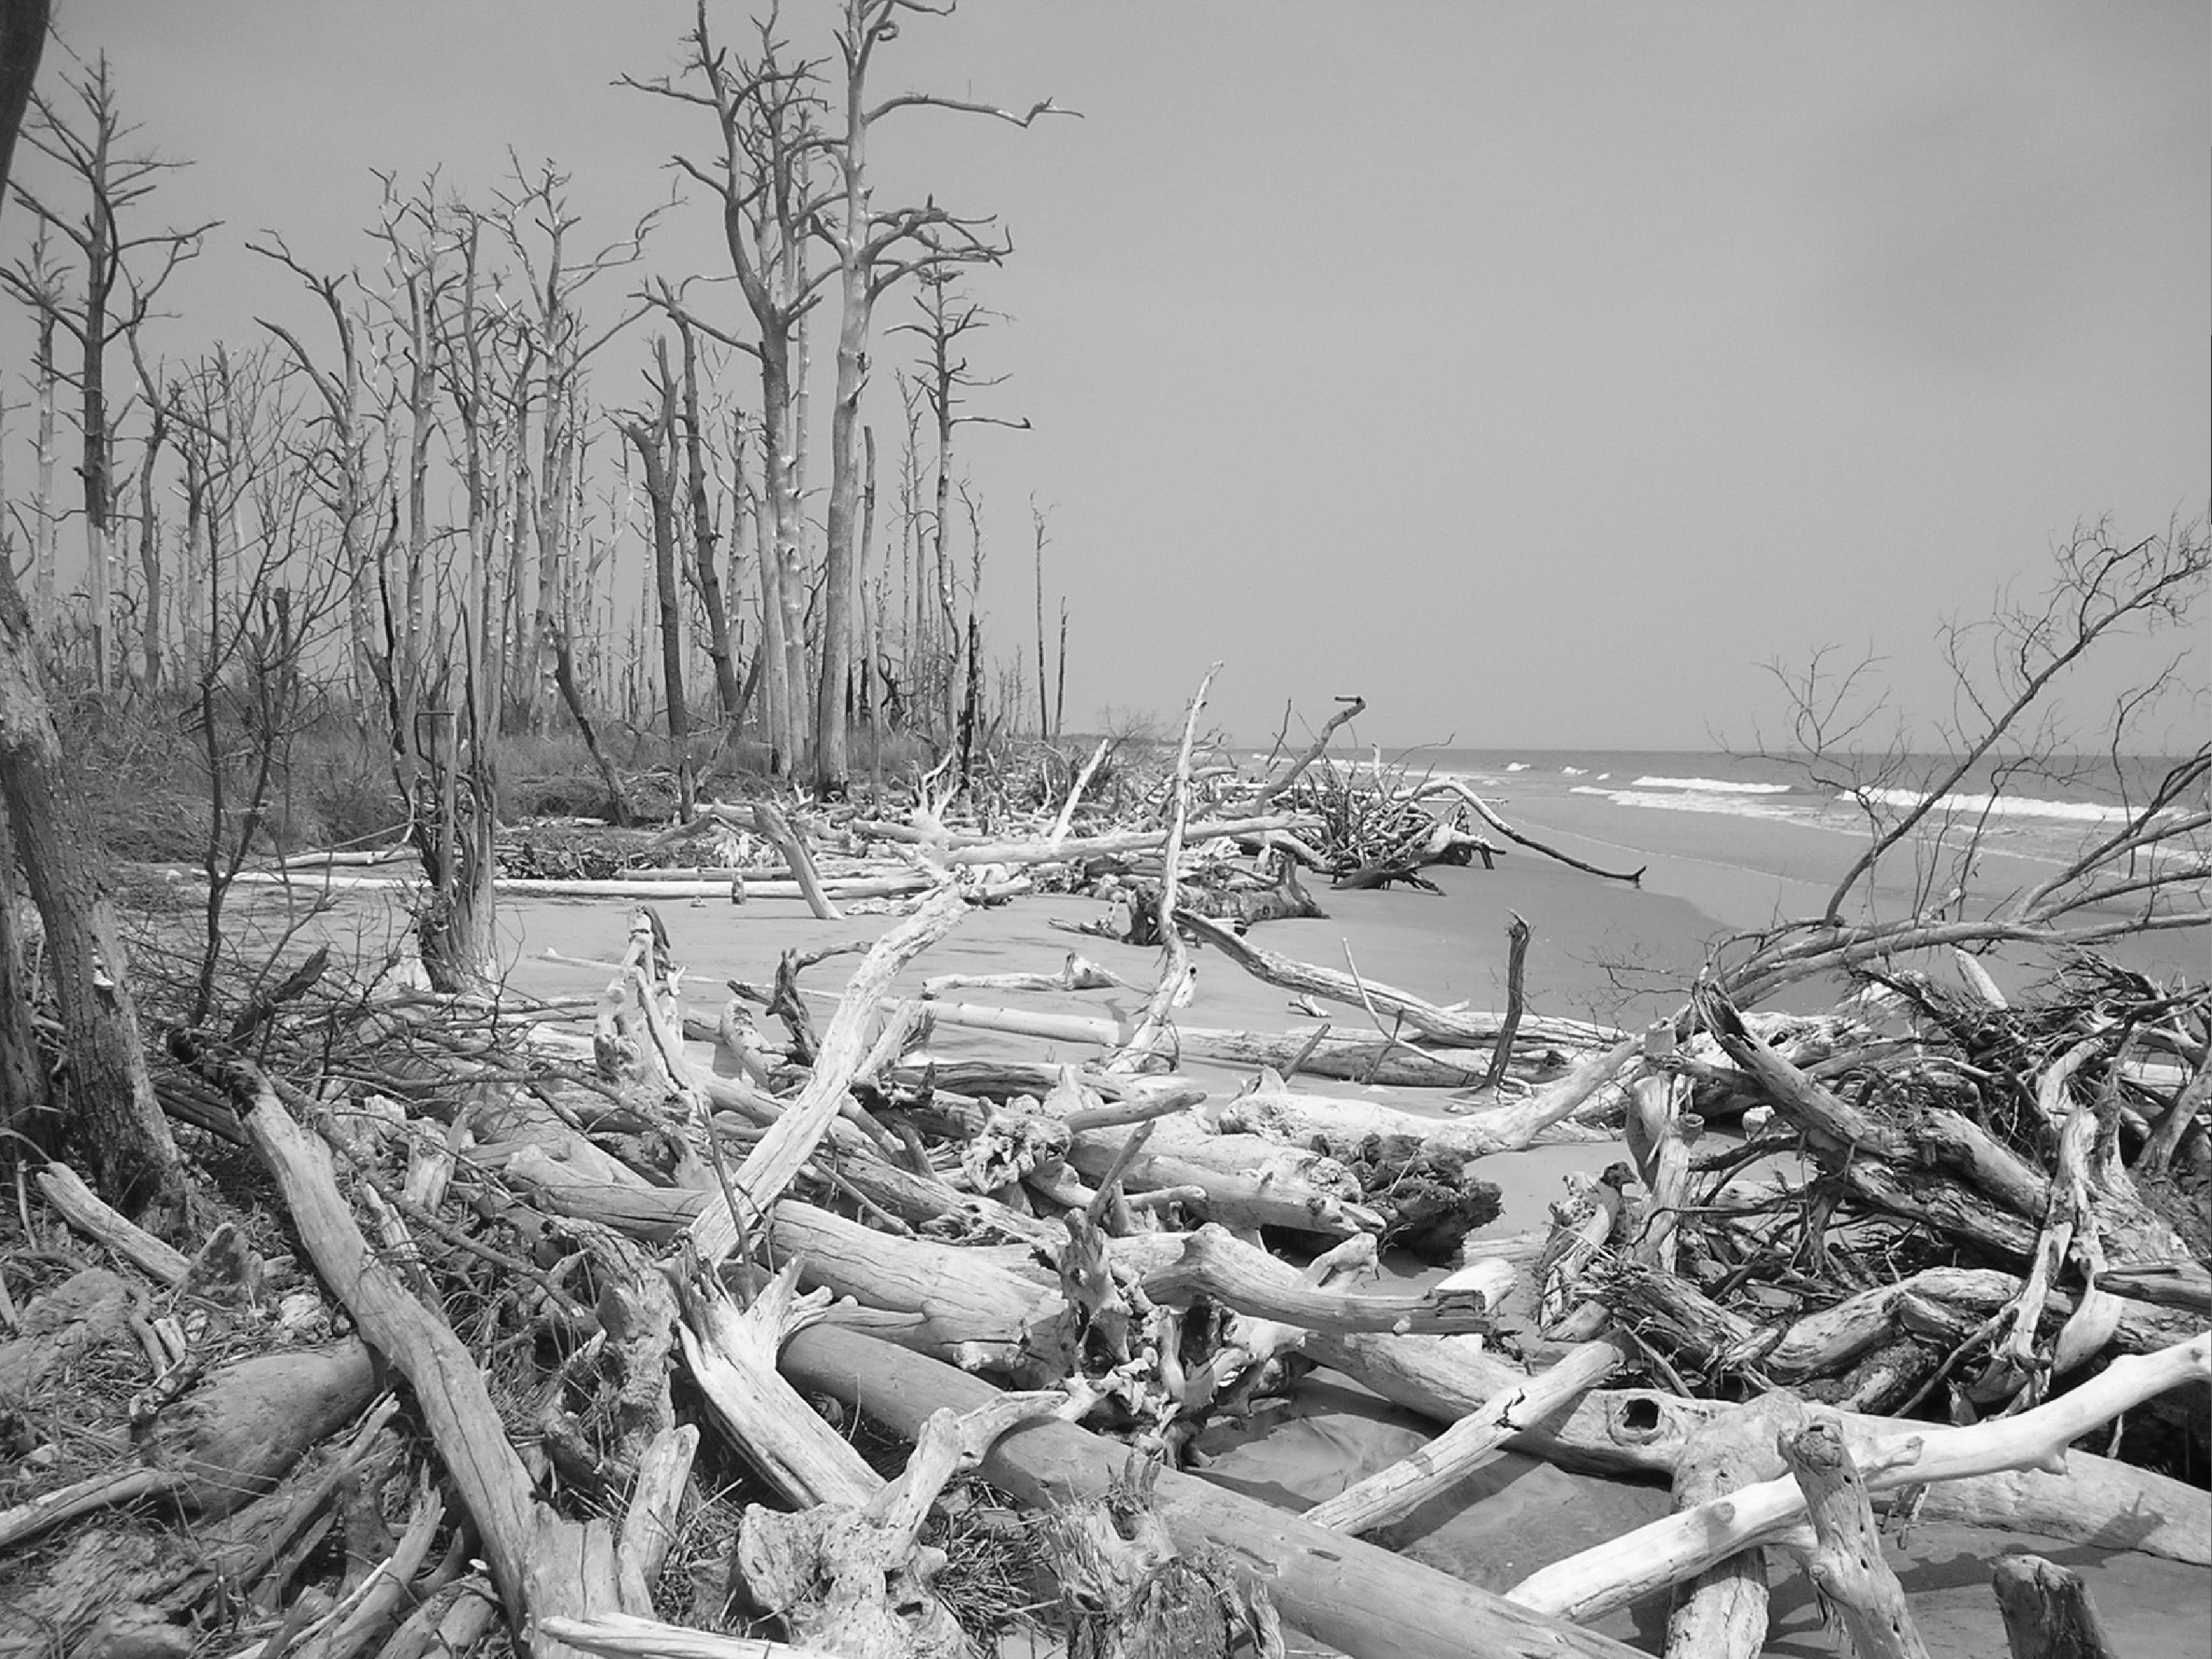
Figure 7: Erosion on Parramore Island, Virginia. The rapidly retreating shoreline is cutting into the island’s maritime forest. Photo was taken in August 2006.
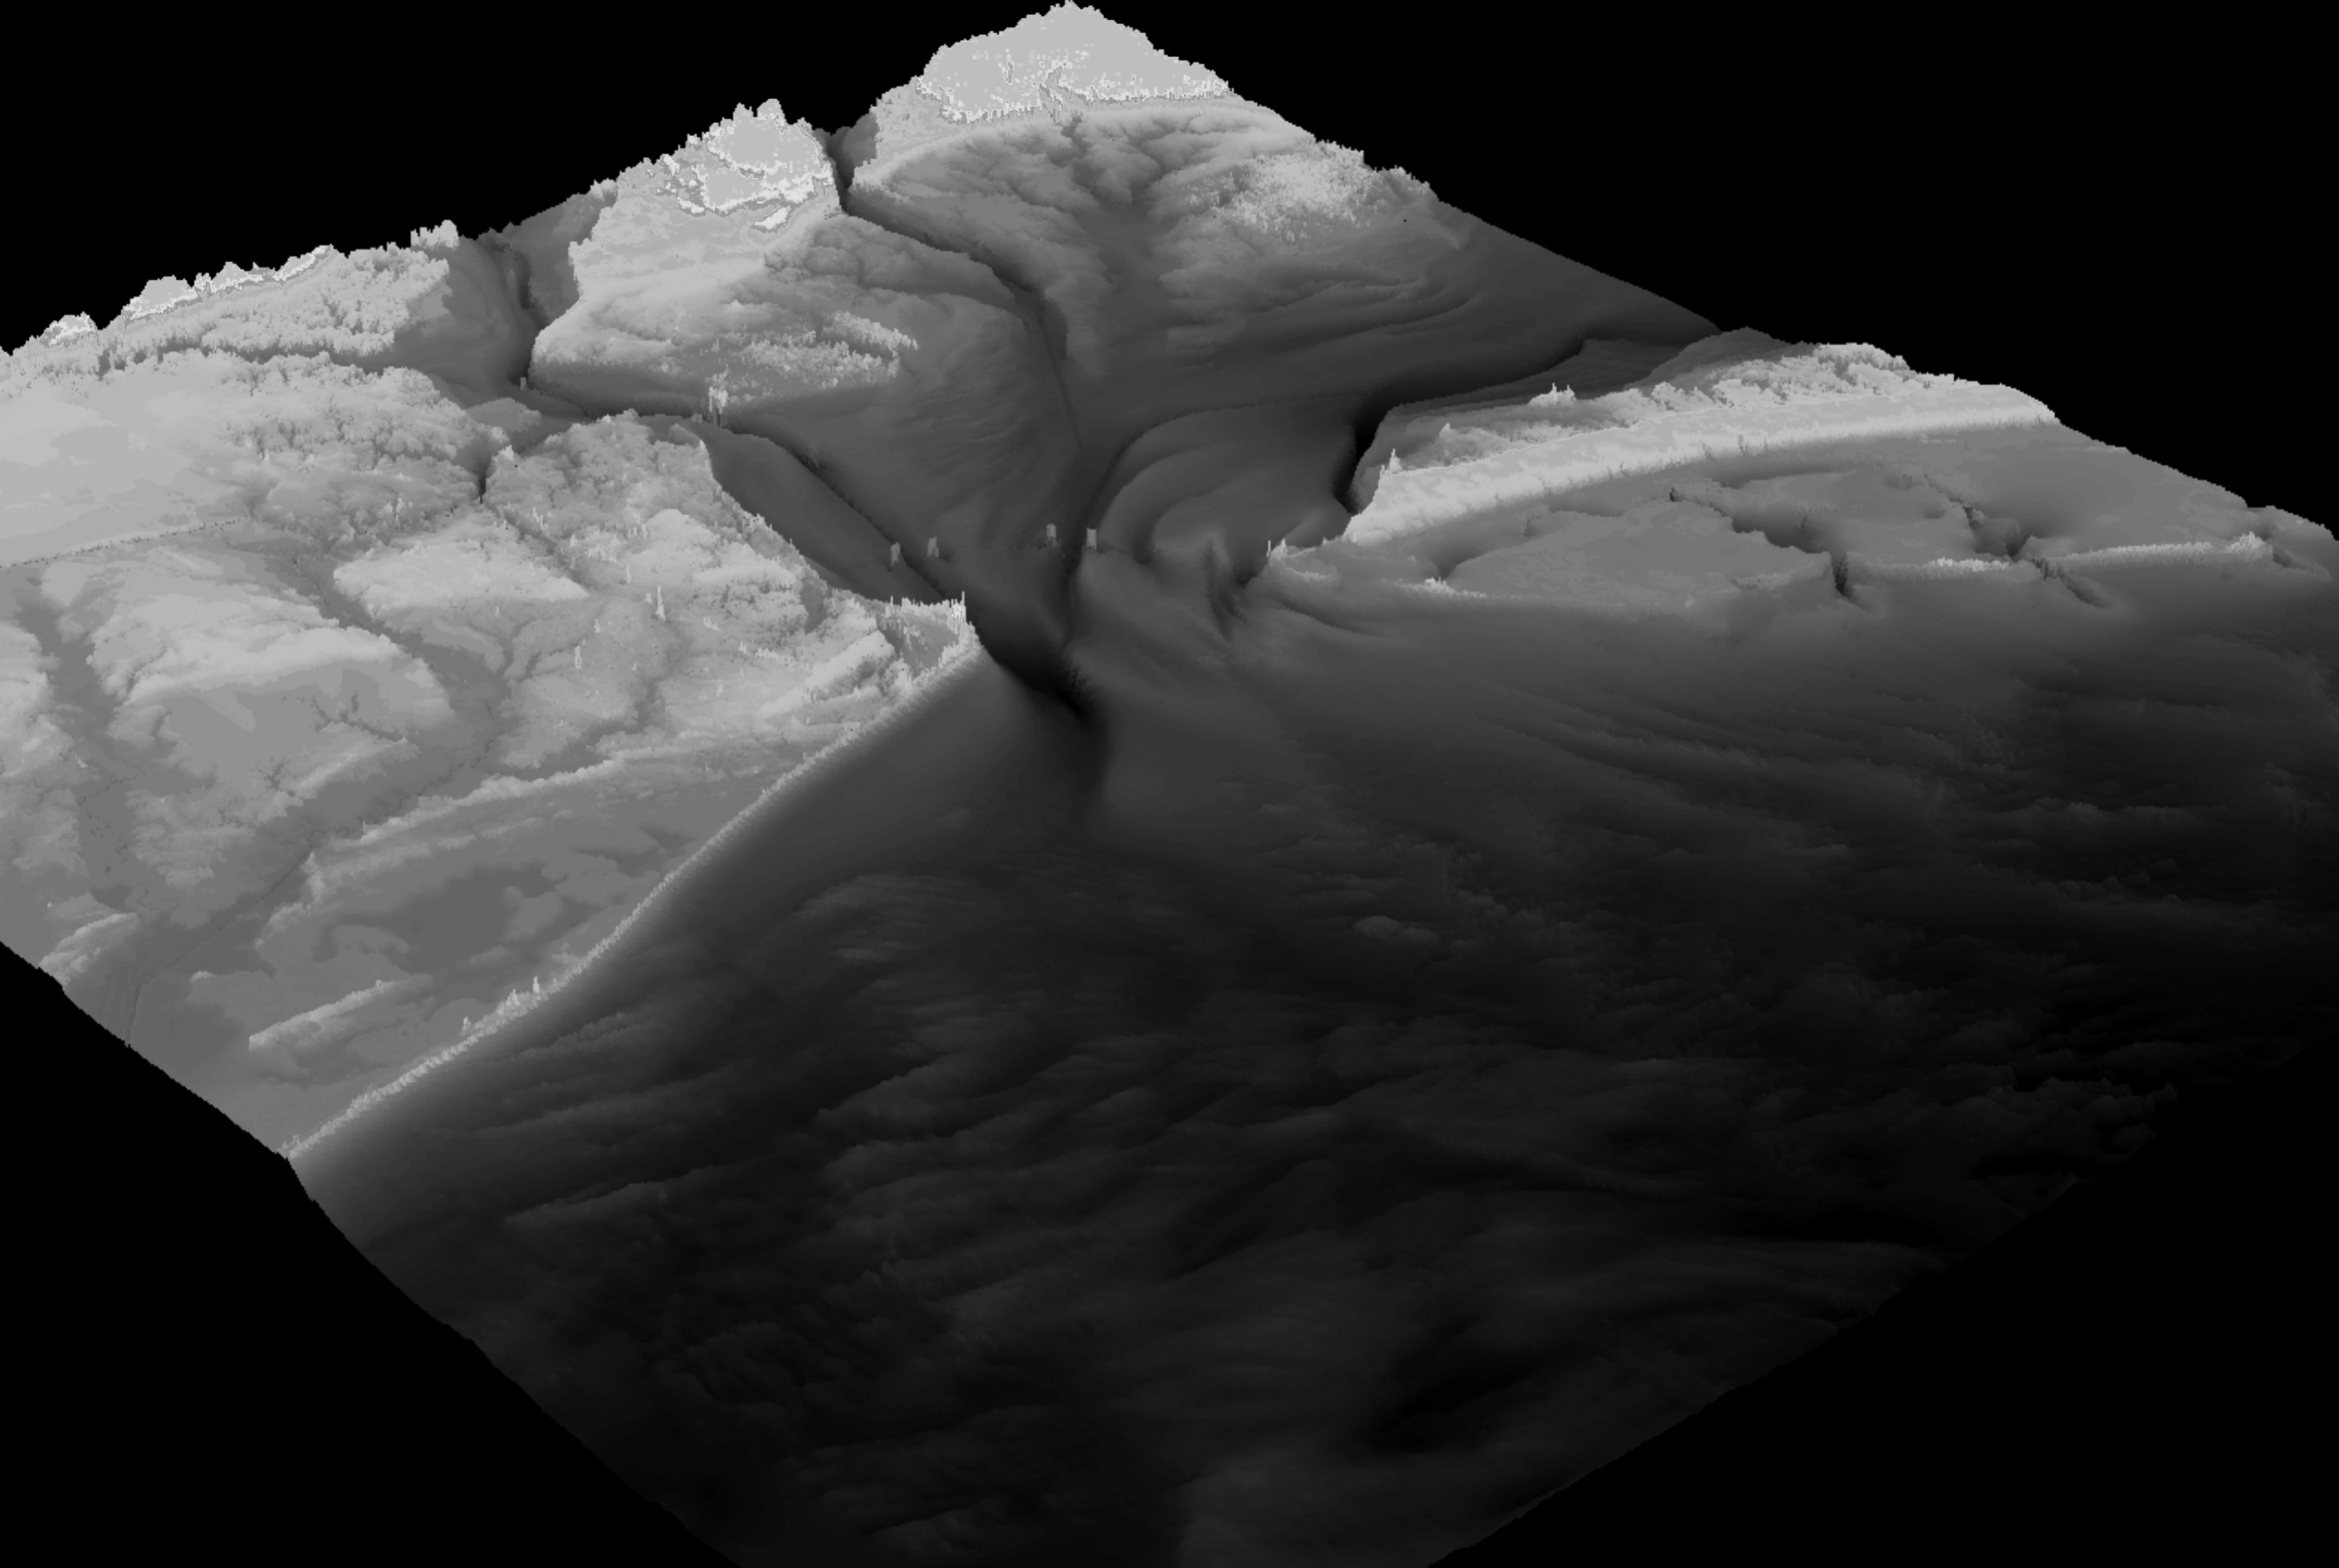
Figure 8: An oblique view depicting the topography of southeastern Virginia, the lower Delmarva Peninsula, the Chesapeake Bay mouth region, and adjacent portions of the continental shelf.
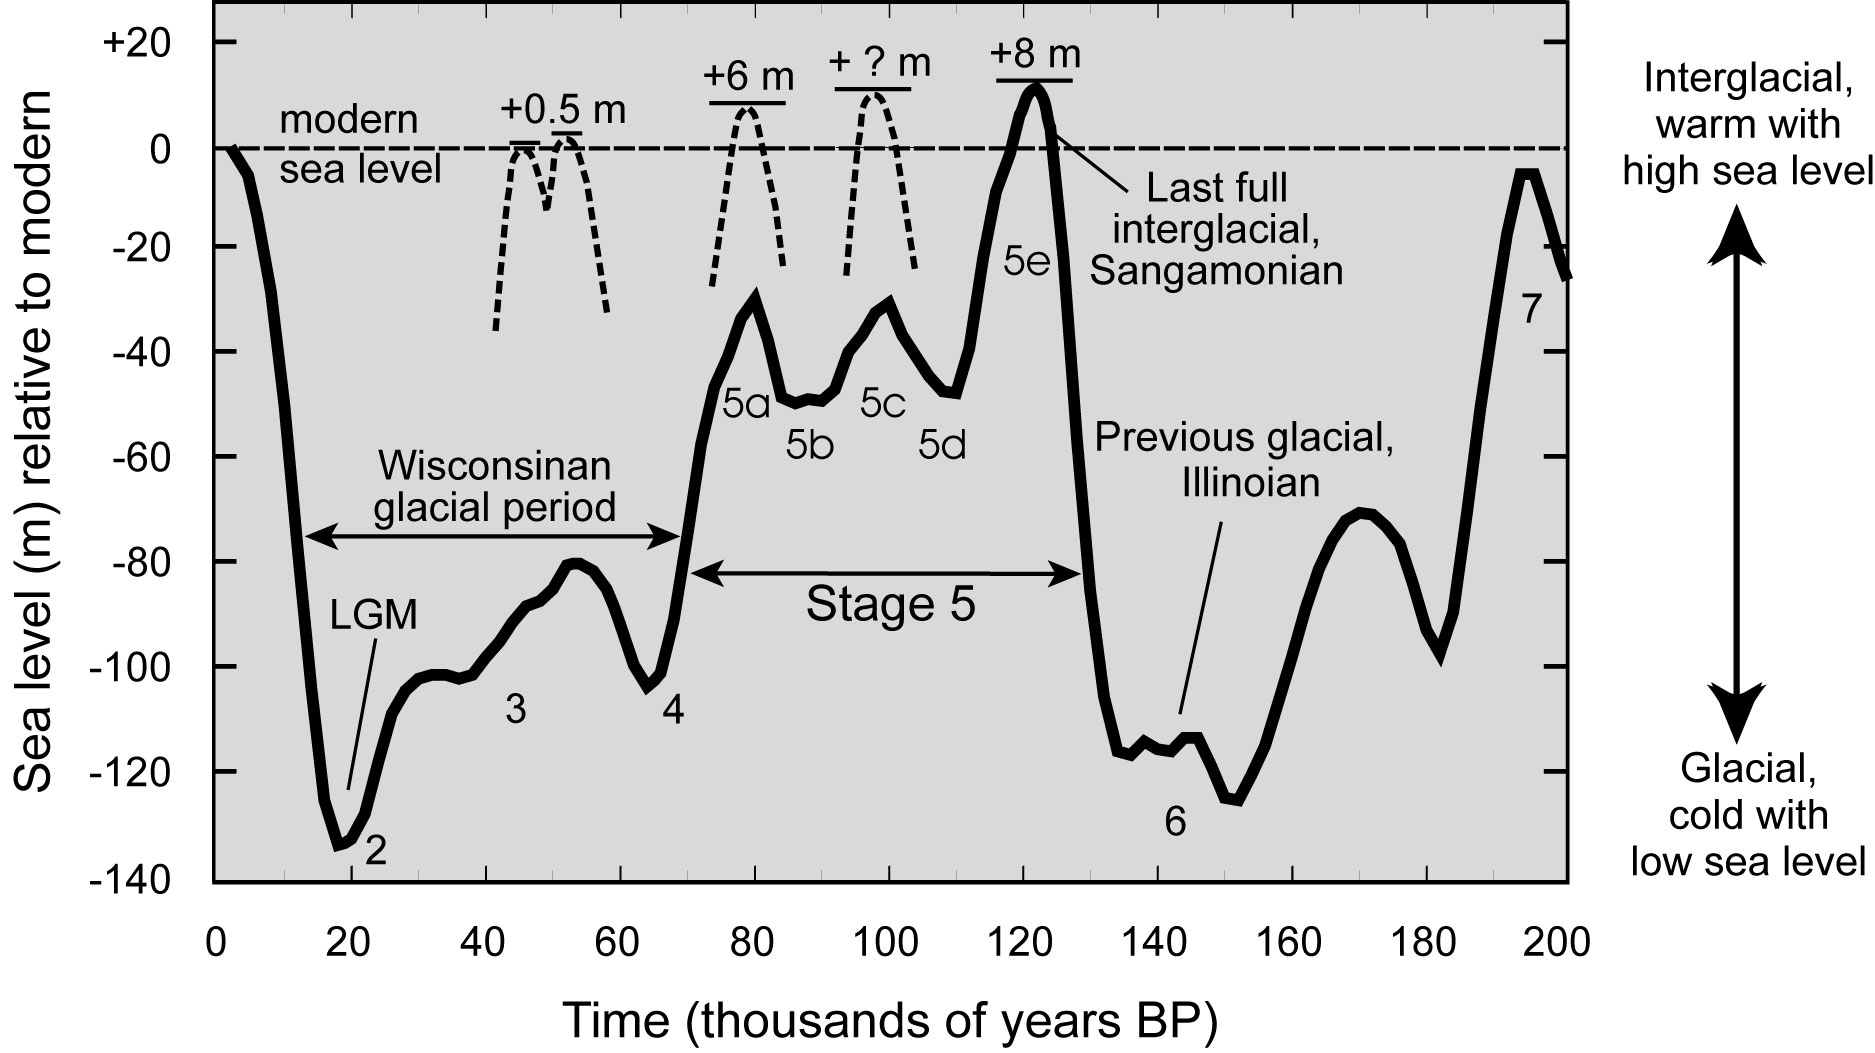
Figure 9: Oxygen isotope record of global ice volume and sea level for the past 200,000 years showing the major glacial and interglacial episodes (data from Martinson et al., 1987). Dashed lines above the curve indicate highstand deposits in the Mid-Atlantic region associated with the global periods of reduced ice volume.
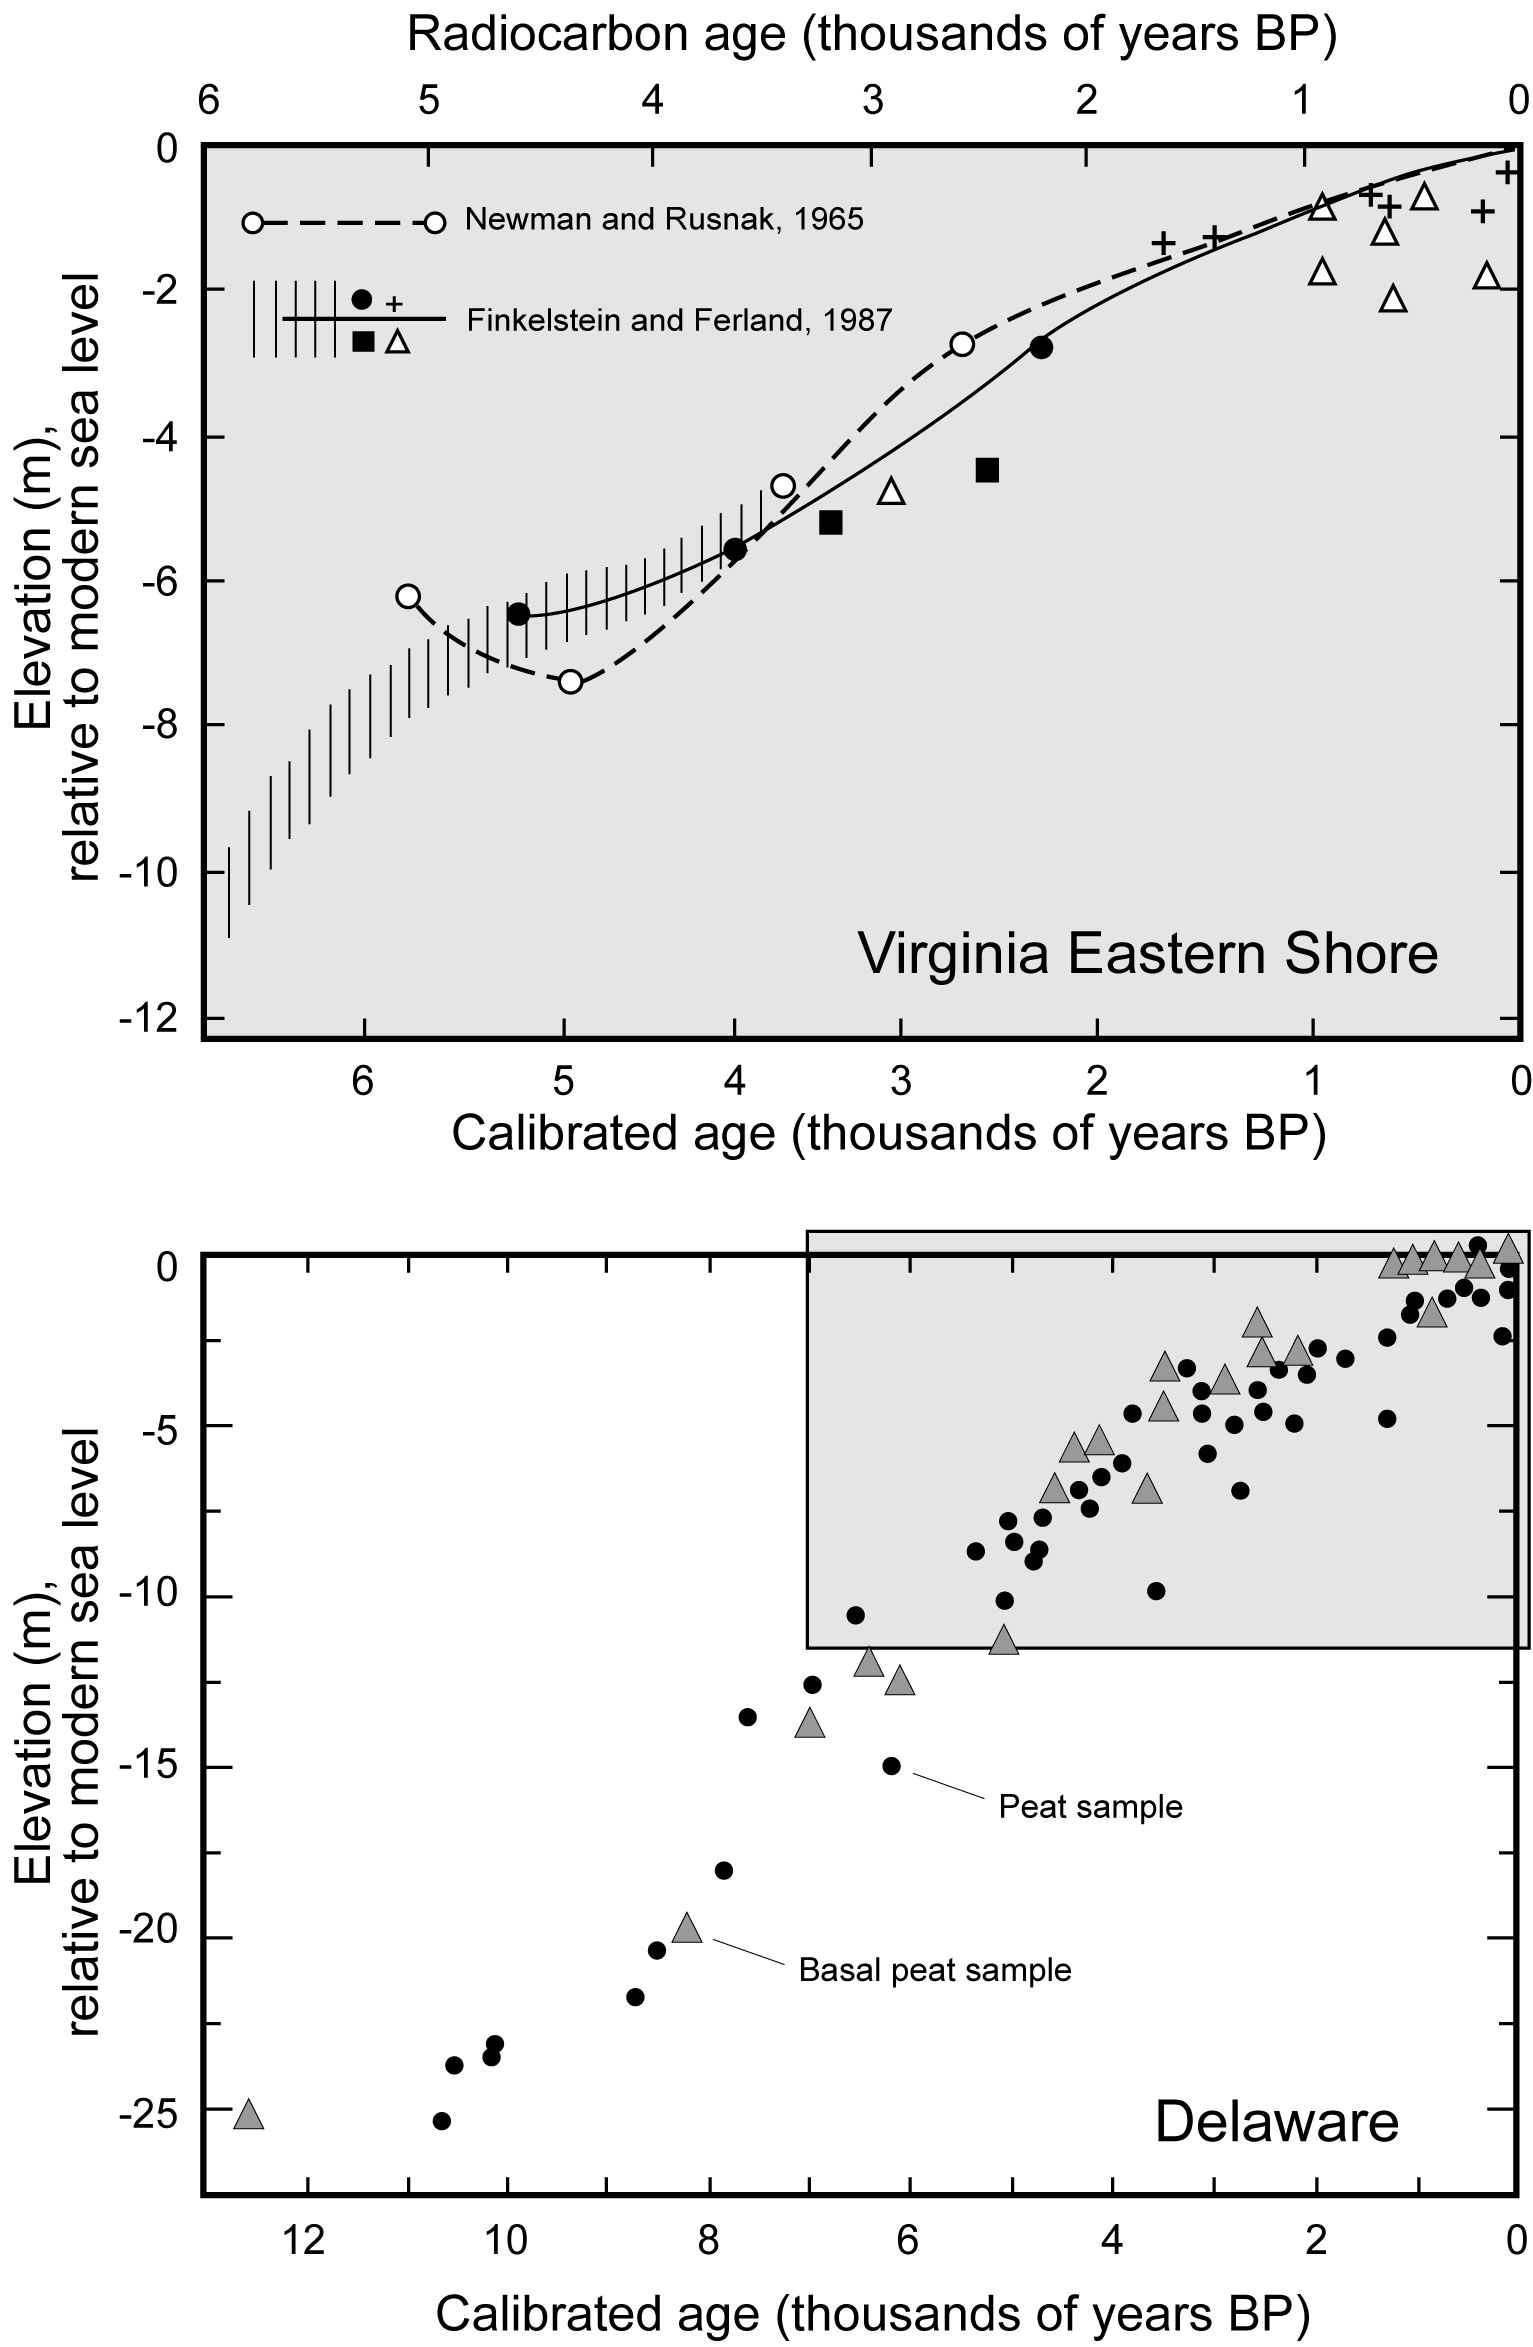
Figure 10. Holocene sea-level curve for the Virginia Eastern Shore (upper panel), modified from Van de Plassche (1990). A more extensive, regional sea-level curve for the Delaware coast drawing mainly from the work of Kraft and his students, as compiled by Ramsey and Baxter (1996). The shaded inset in the lower panel is the equivalent age and elevation range as the upper panel.
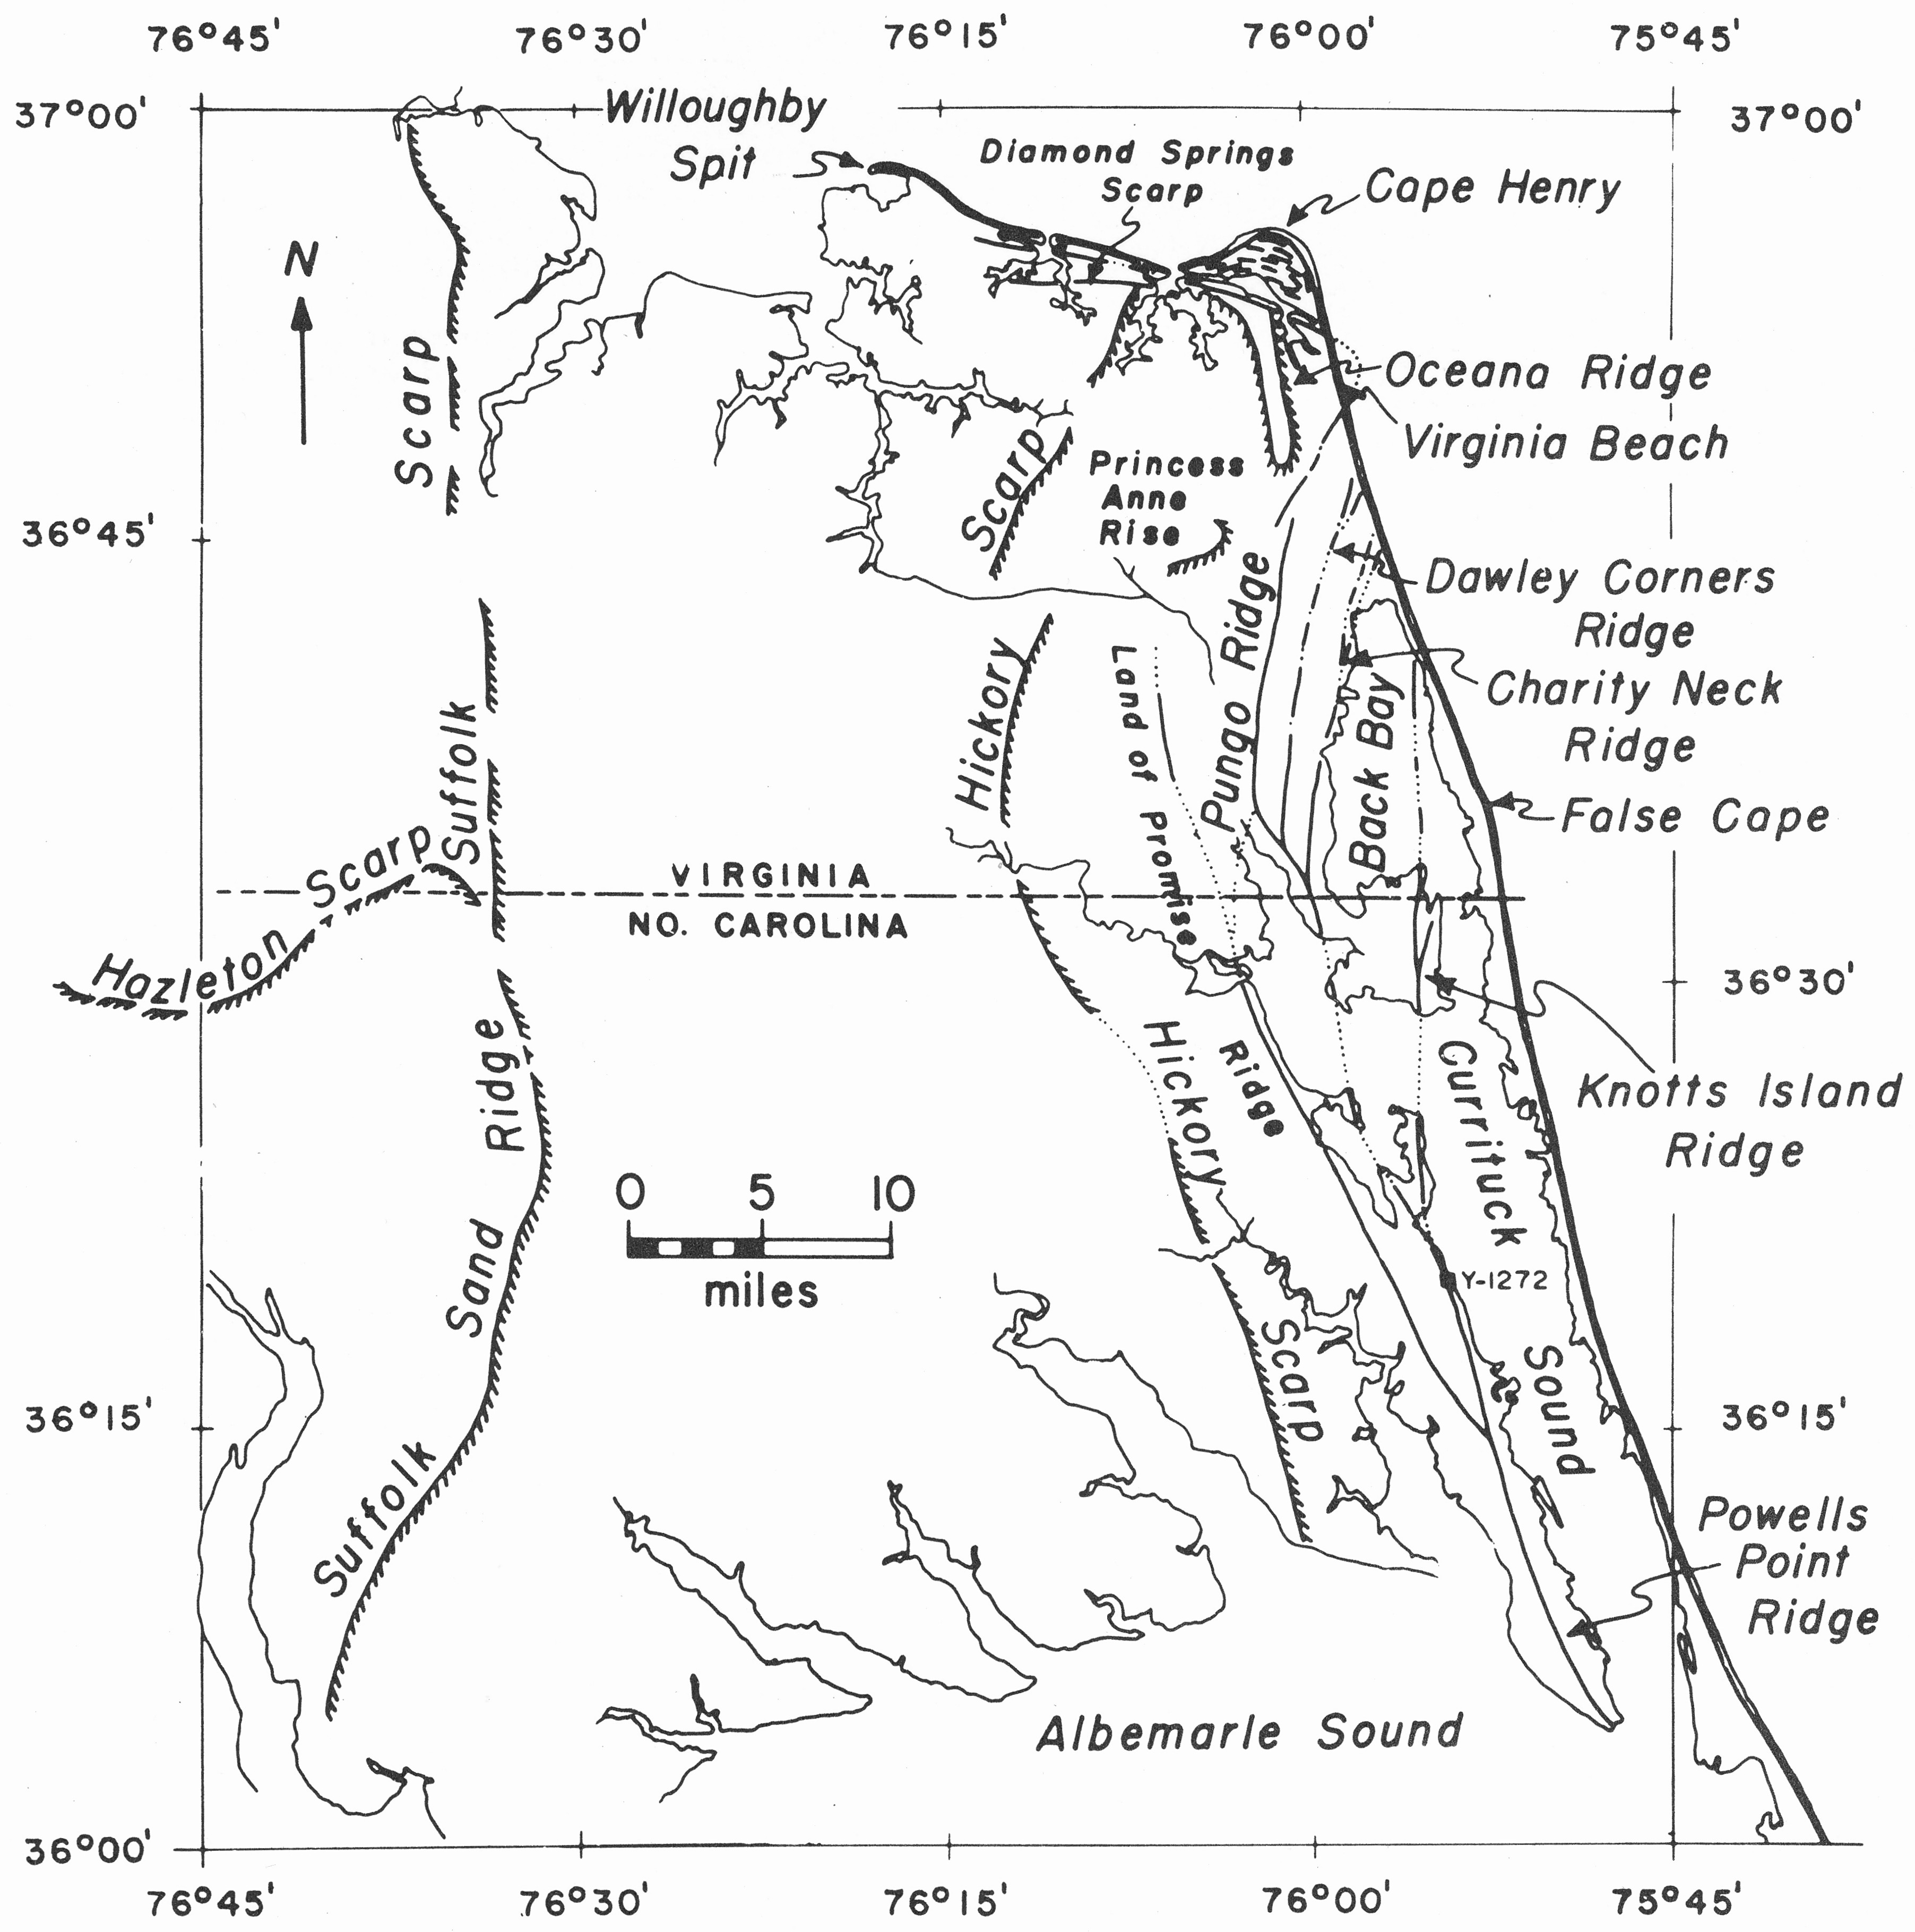
Figure 11. Late Quaternary scarps and shoreline ridges in southeastern Virginia and northeastern North Carolina, from Oaks et al. (1974).
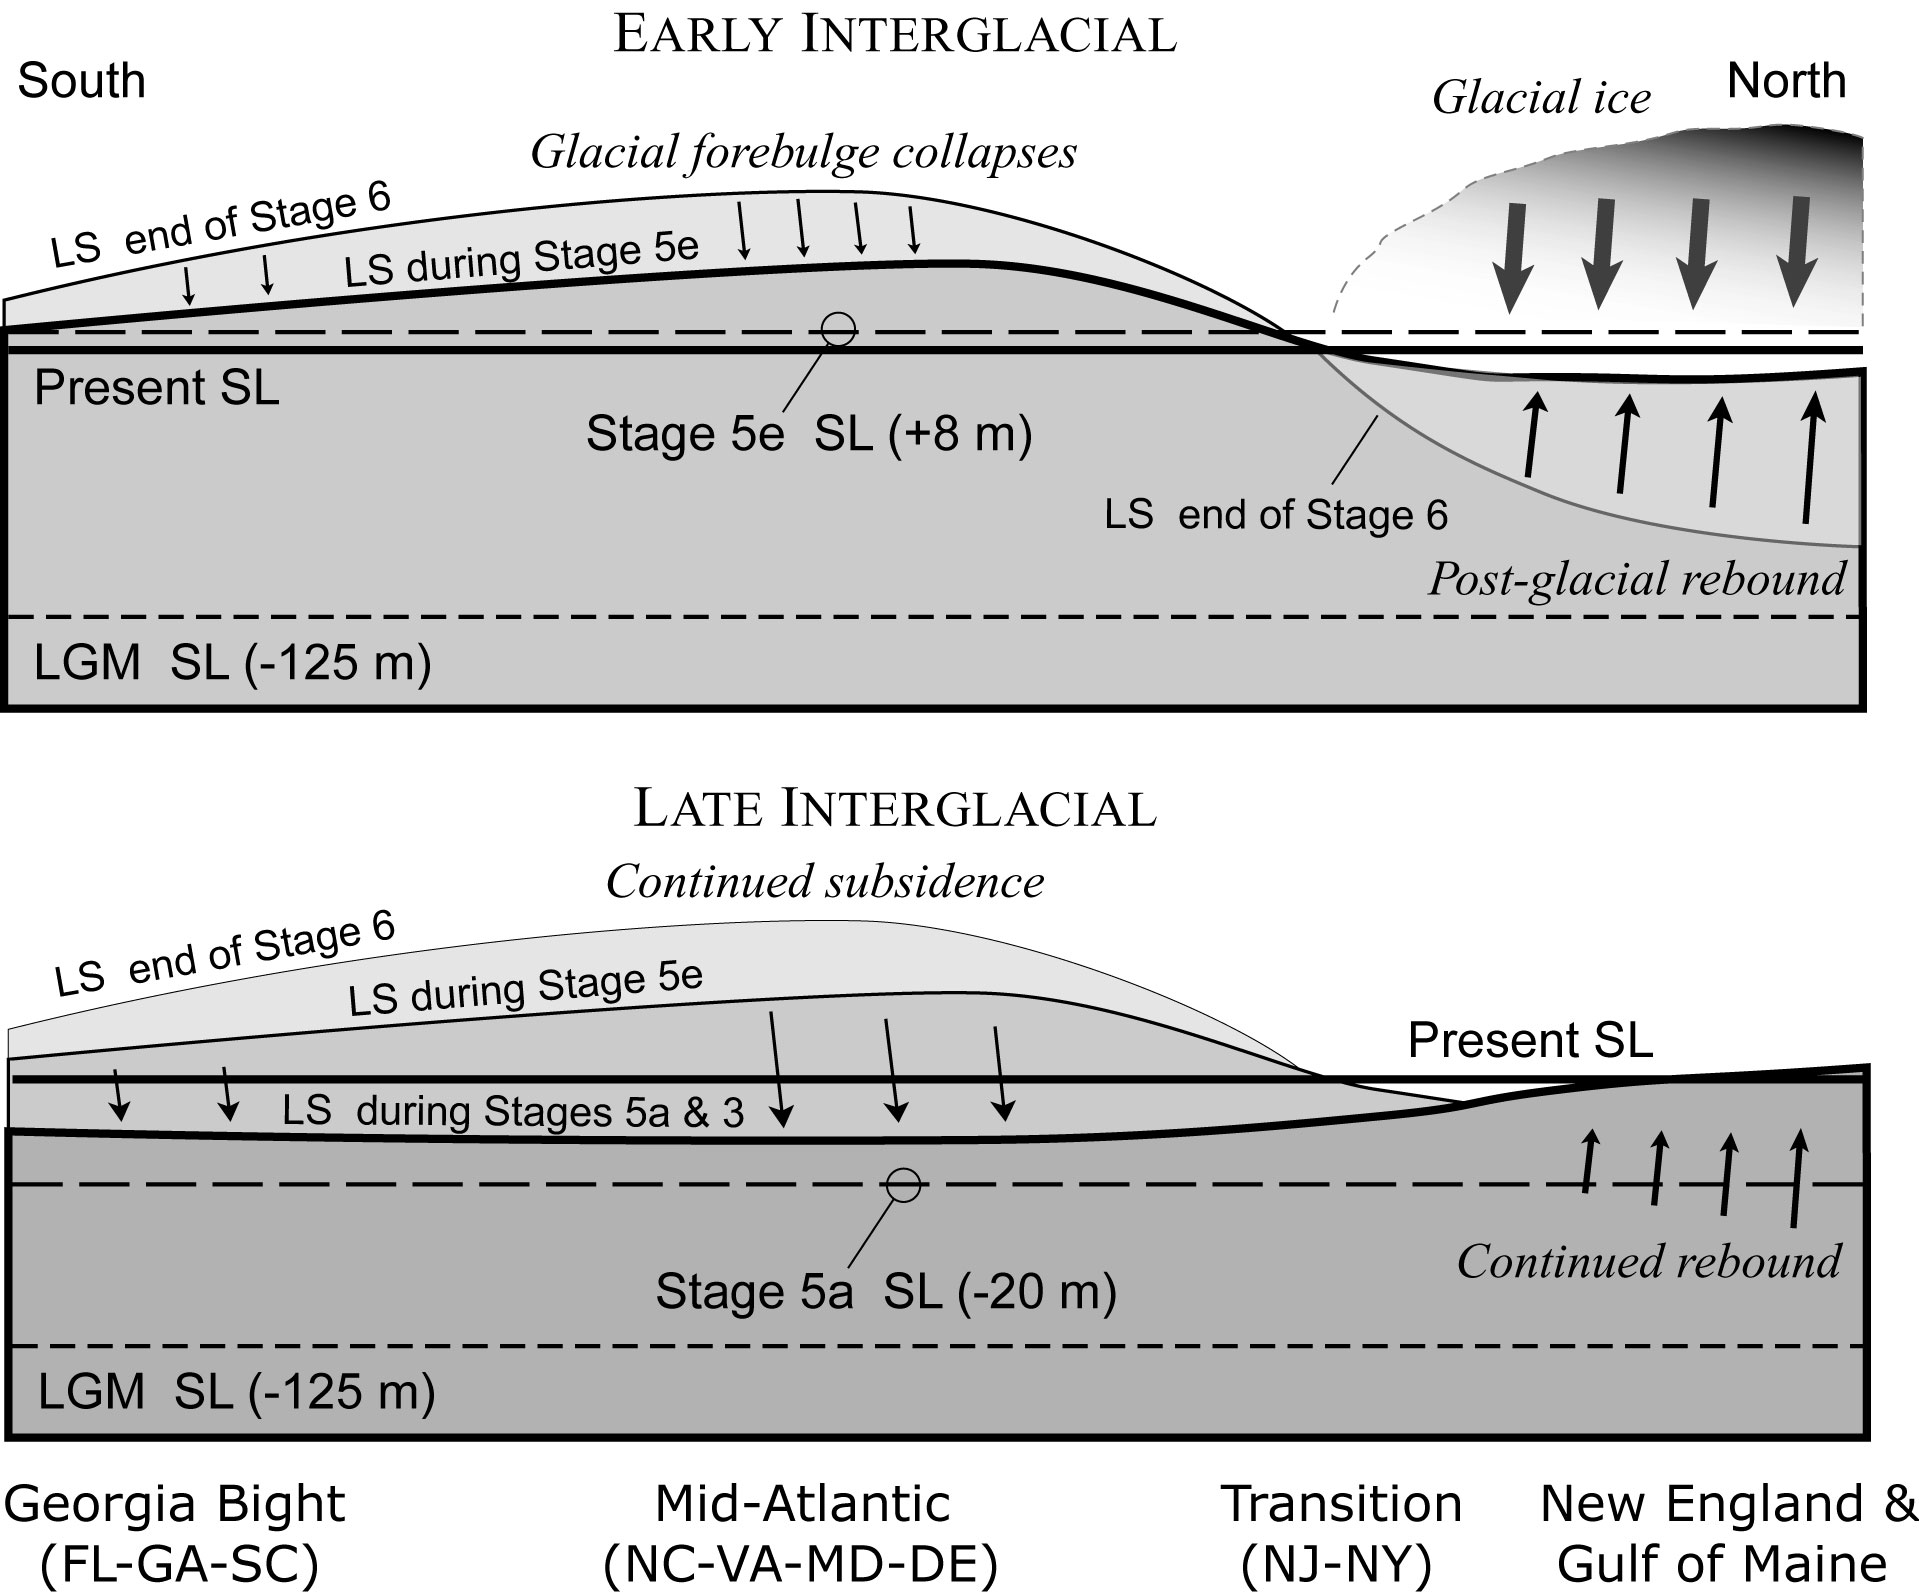
Figure 12. Regional isostatic response of the Atlantic coast after the Illinoisan glaciation (marine isotope stage 6). This model follows from recent findings by Wehmiller et al. (2004) and Mallinson et al. (2008) of late stage 5 and stage 3 highstand shorelines preserved on the outer coastal plain of Virginia and North Carolina approximately 22 to 26 m higher than expected from records of global ice volume. During the early part of the interglacial period following melting of the ice sheet, the glacial forebulge collapsed and retreated northward. The elevation of the land surface at this time (Sangamonian, or substage 5e) would have been equivalent to the present. However, toward the later part of the interglacial, with continued subsidence of the forebulge in conjunction with hydroisostatic depression of the continental margin, the land surface was lowered by an additional ~25 m.
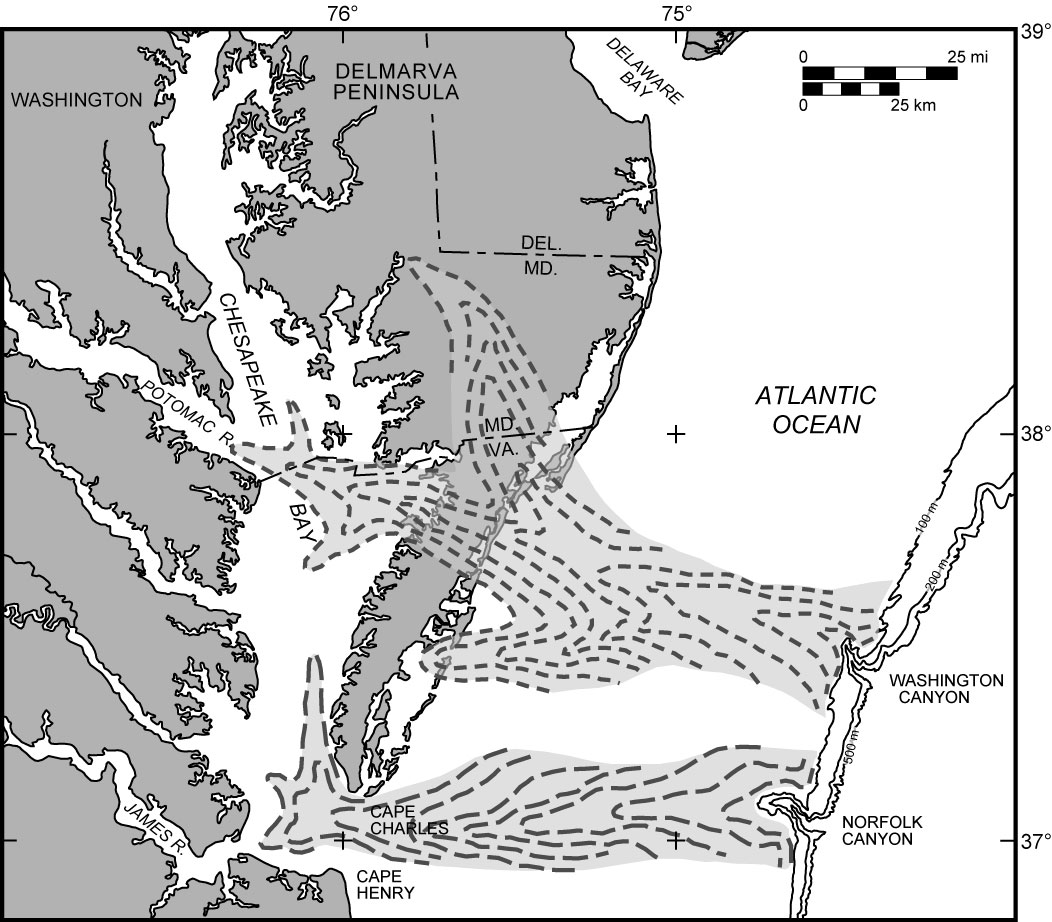
Figure 13. Inference by Harrison (1972) of a paleovalley of the Potomac River crossing the northern section of the modern Virginia Eastern Shore, and heading to Washington Canyon. His interpretation included the recently discovered Salisbury (Maryland) paleochannel as a tributary to the Potomac River, and also connected the ancestral James River with Norfolk Canyon.
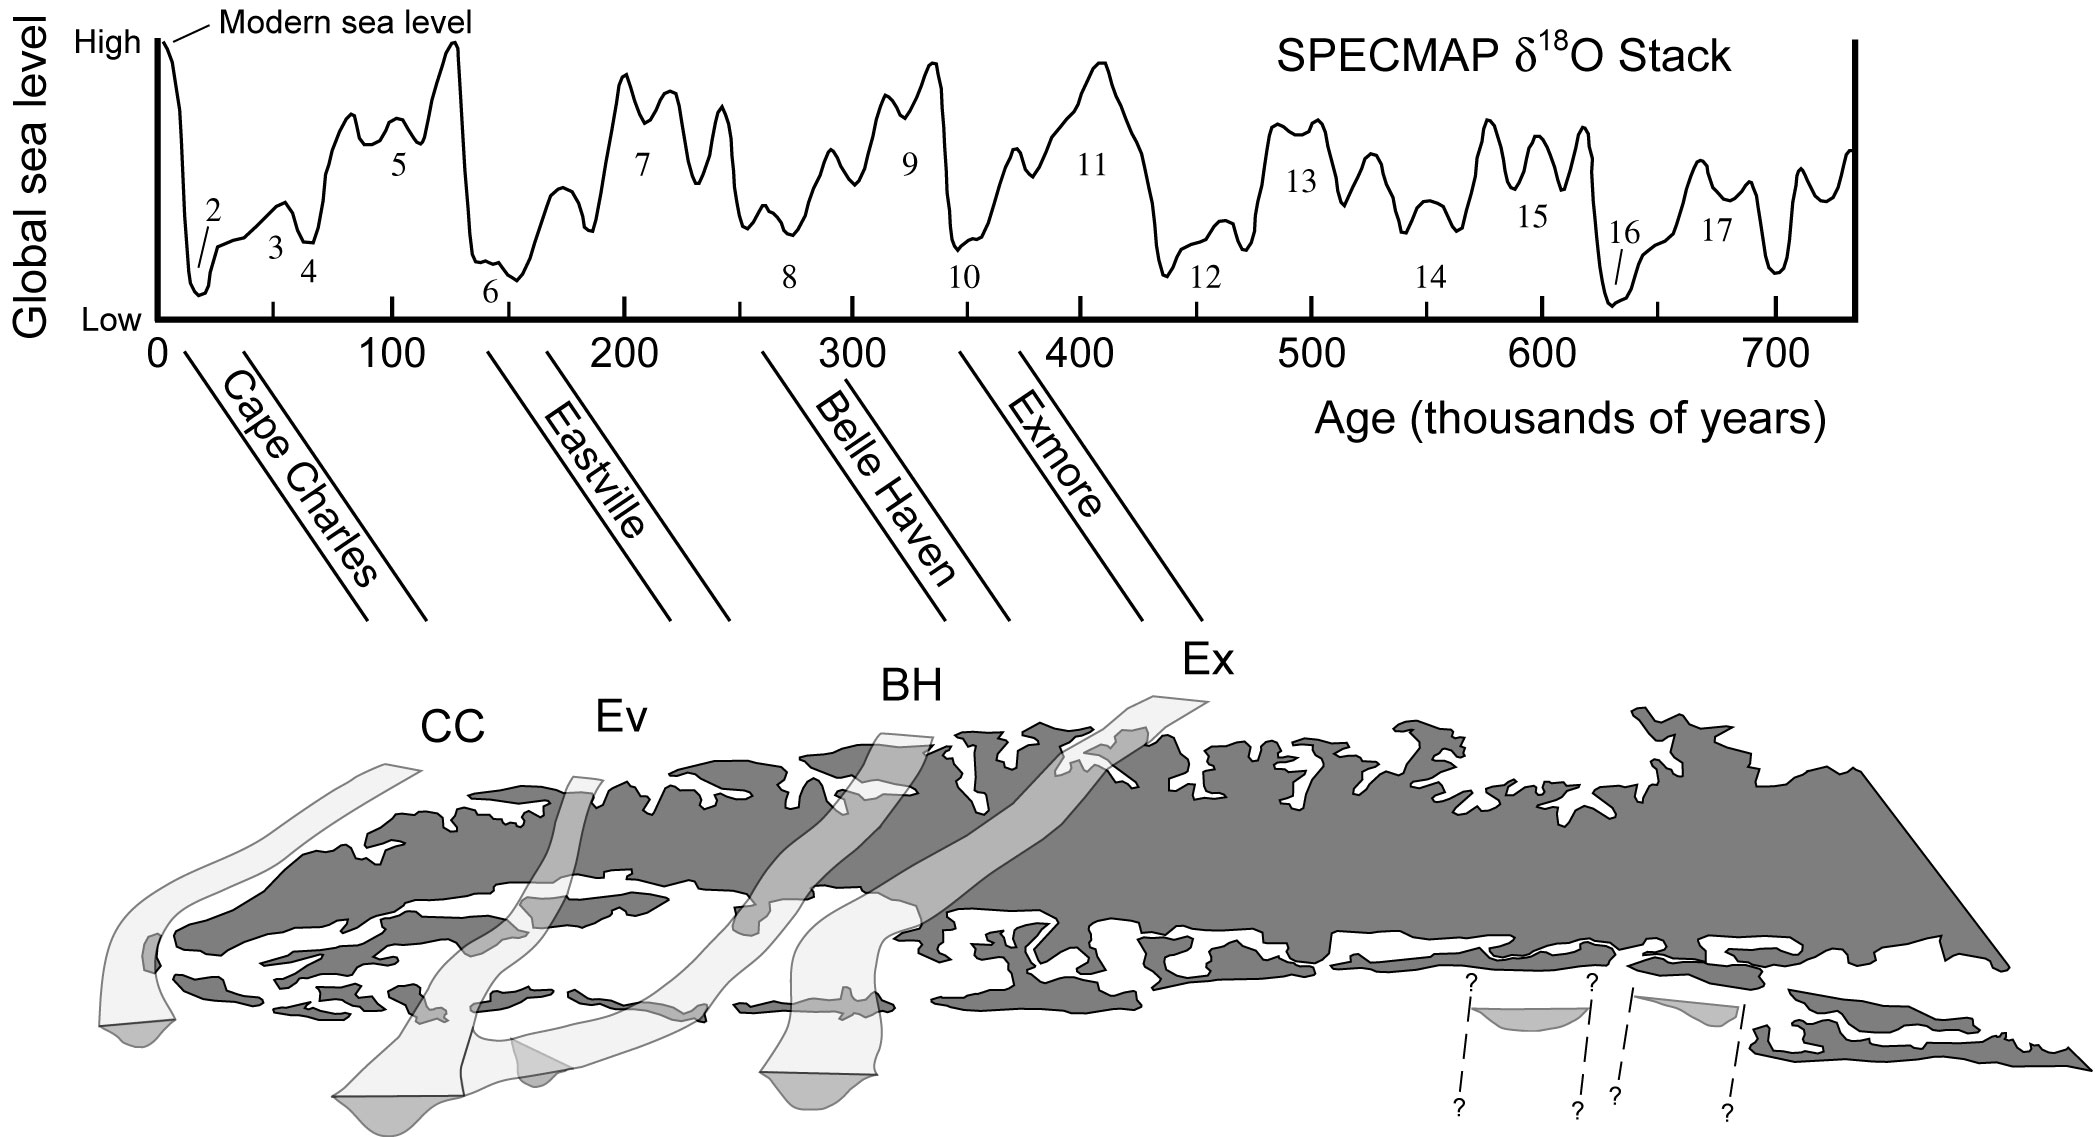
Figure 14. Paths of the four known middle to late Pleistocene paleochannels of the combined Susquehanna-Potomac River system crossing beneath the modern Virginia Eastern Shore. The ages of these channels have been debated, but a simple chronology correlates each with the four full glaciations of the past 400 ky. At least two additional large paleochannels, possibly of an ancestral Potomac River, were discovered recently off Assawoman and Wallops Islands (Krantz et al., unpublished data).
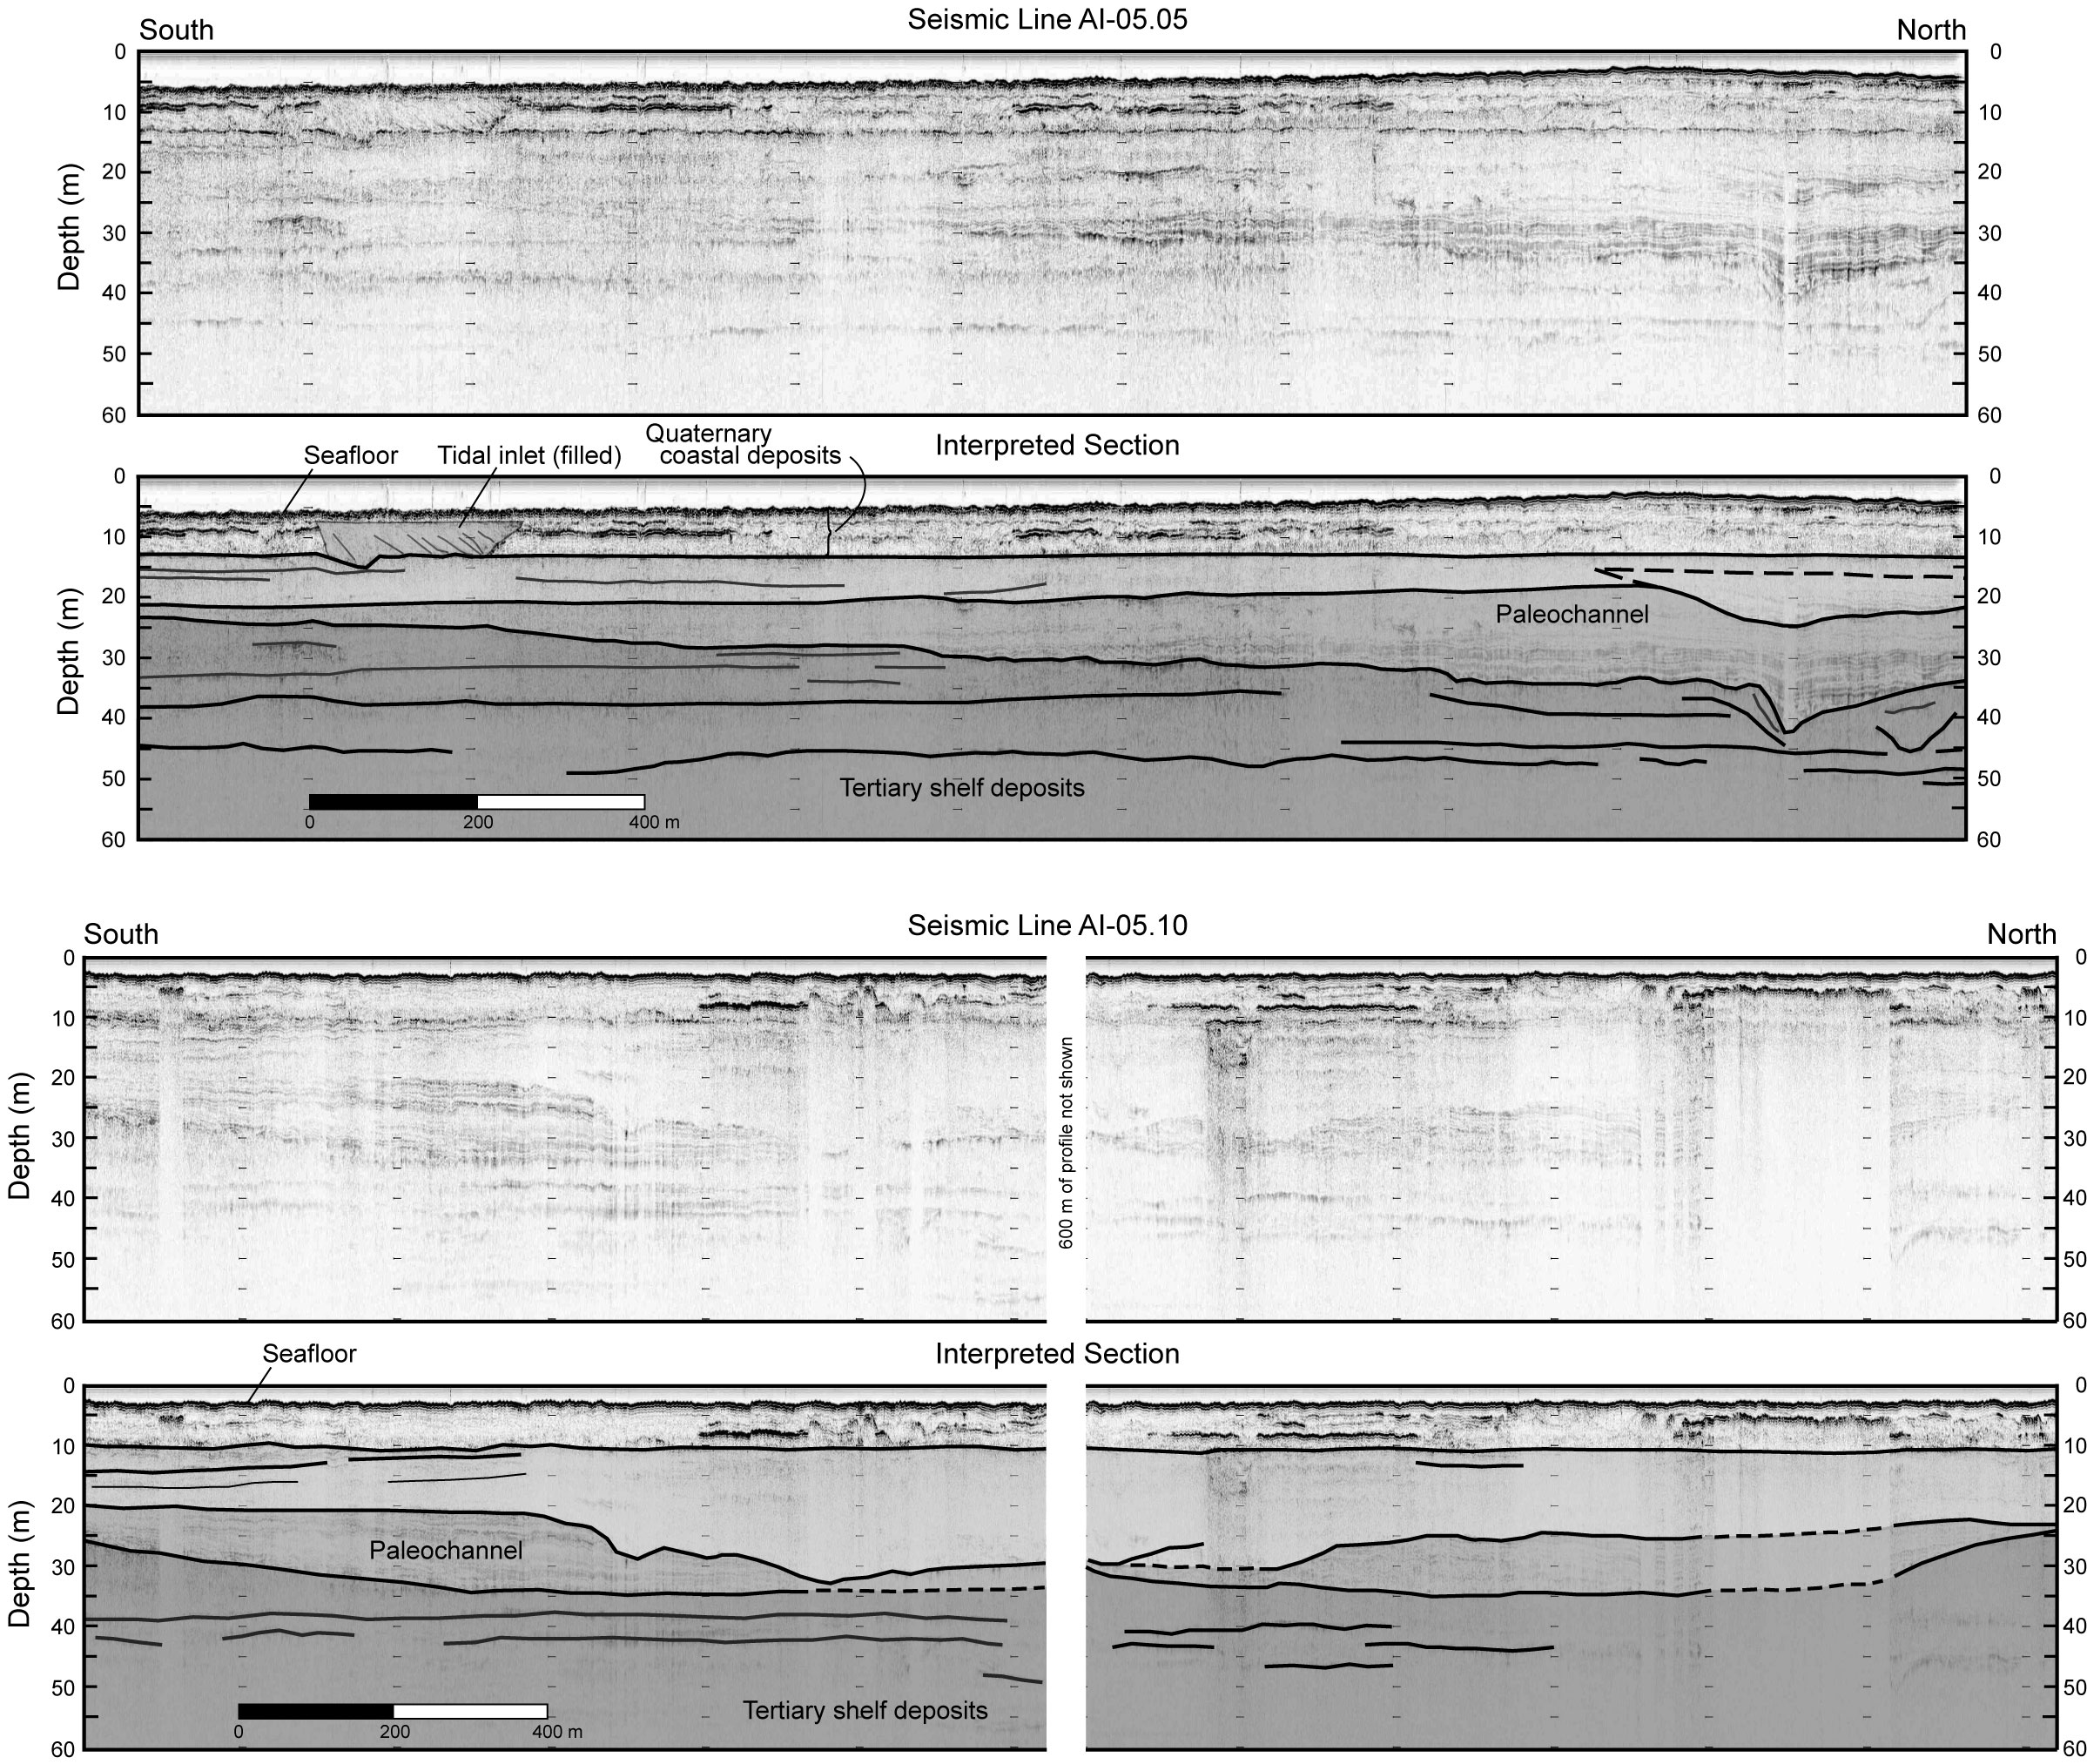
Figure 15a. Seismic sections of two paleochannels off Wallops Island (section AI-05.05) and off Assawoman Island (section AI-05.10) in the Chincoteague Bight with interpretation of primary stratigraphic units (Krantz et al., unpublished data).
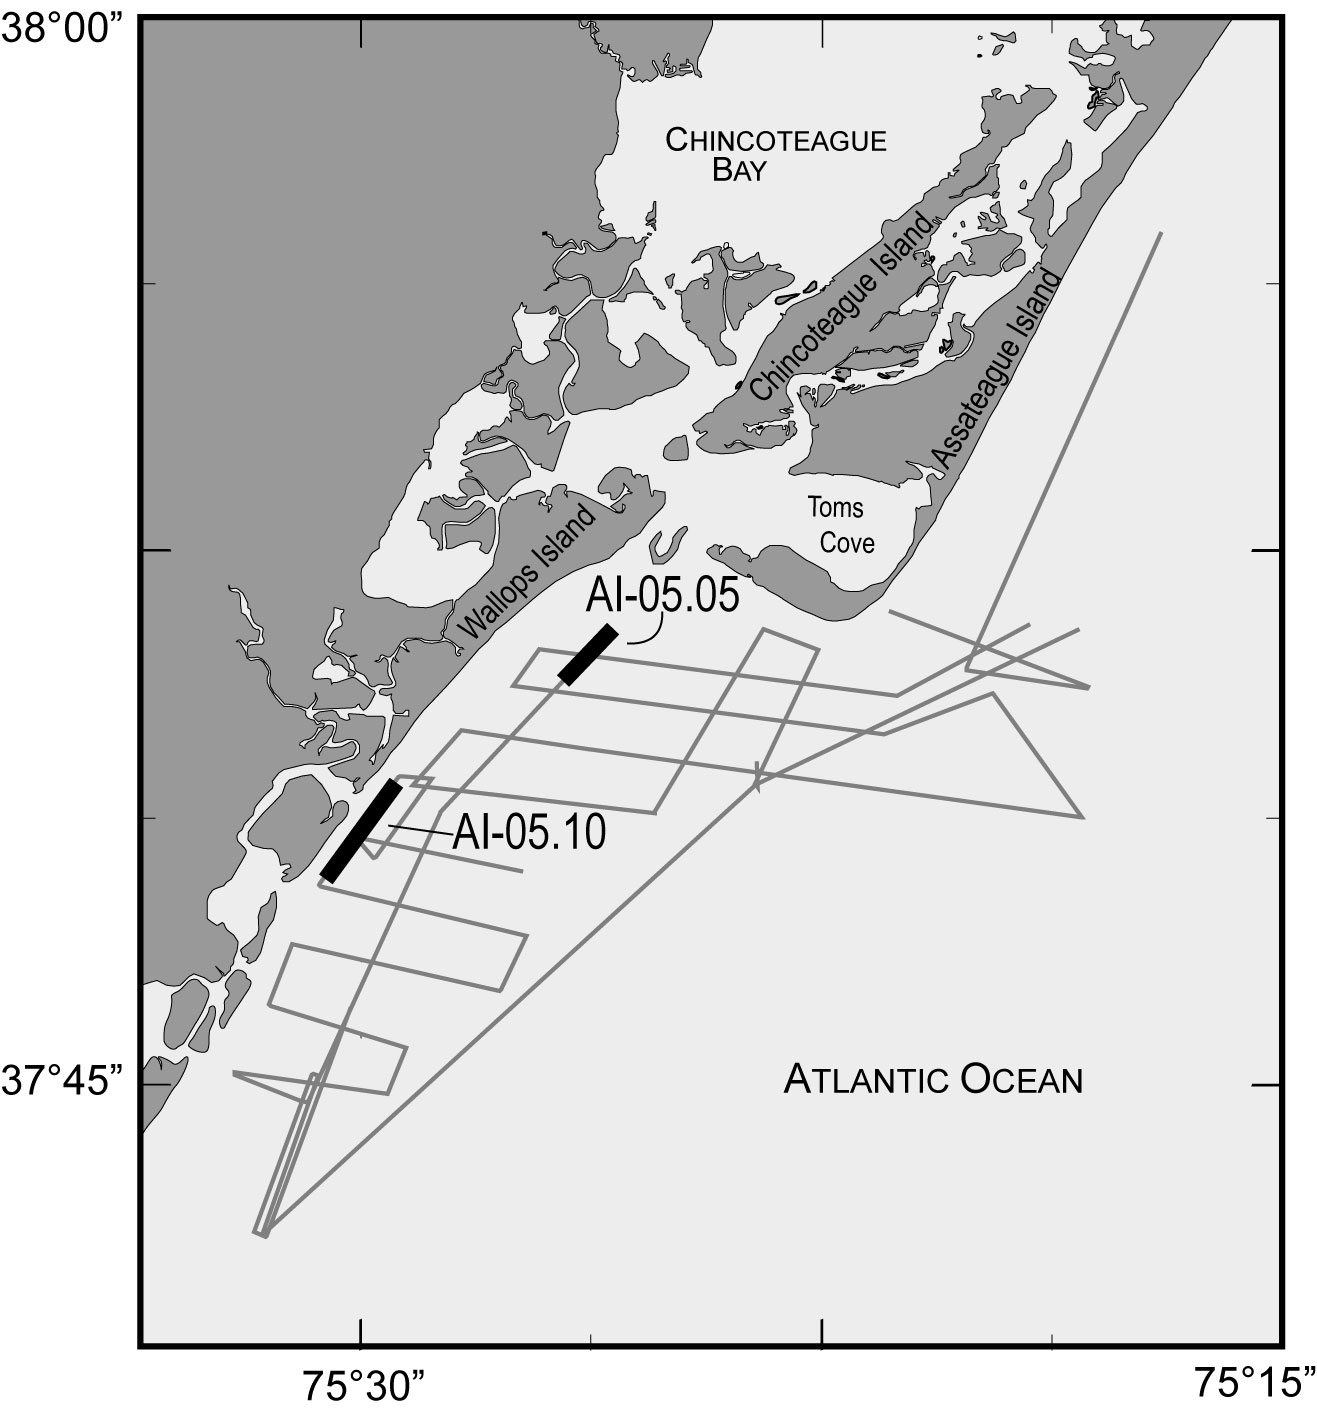
Figure 15b. Map of the northern Chincoteague Bight showing tracklines and seismic sections presented in Figure 15a.