Ocean City Tide Records
NOAA Tide Gauge Station 8570280, Ocean City Fishing Pier, Maryland
To go directly to the website:
http://tidesandcurrents.noaa.gov/data_menu.shtml?bdate=19910101&bdate_Month=0&edate=19910131&edate_Month=0&wl_sensor_hist=W2&relative=&datum=5&unit=0&shift=g&stn=8570280+Ocean+City%2C+Fishing+Pier%2C+MD&type=Historic+Tide+Data&format=View+Plot
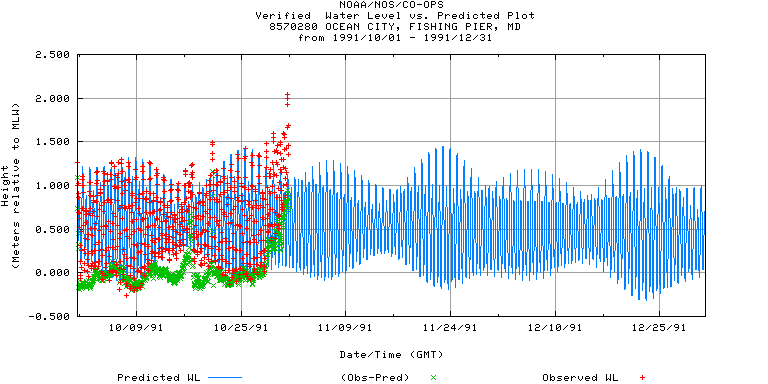
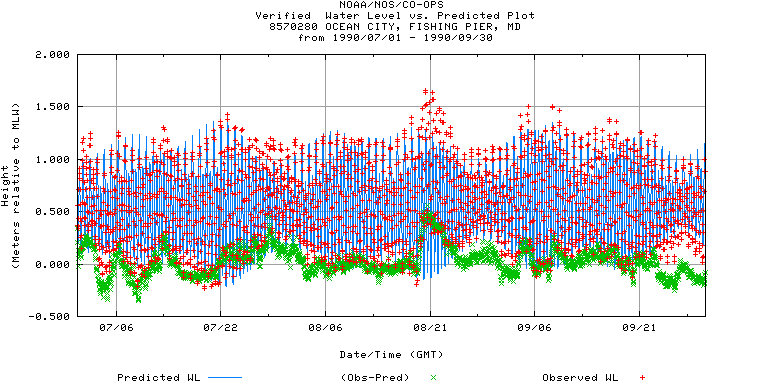
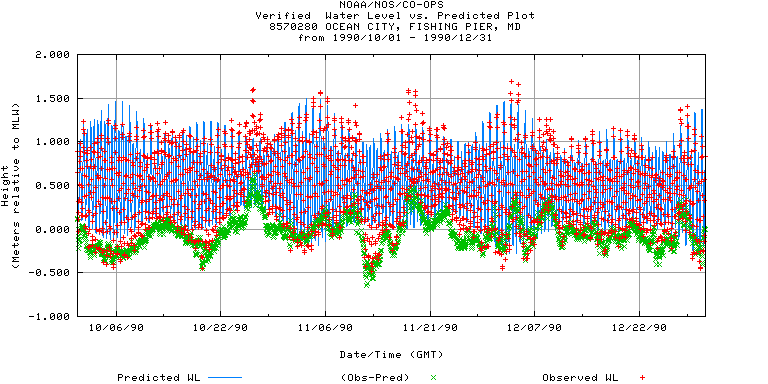
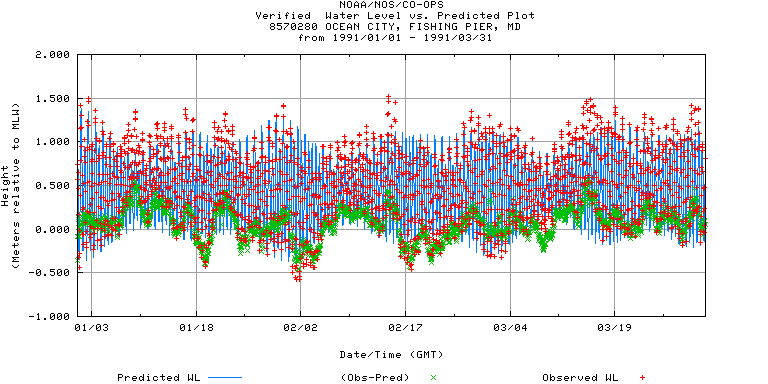
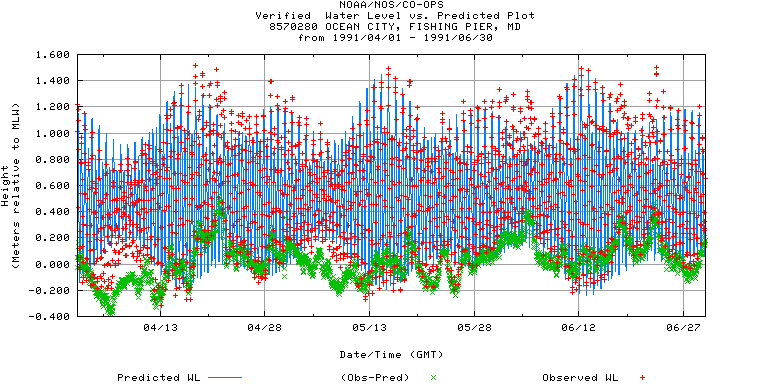
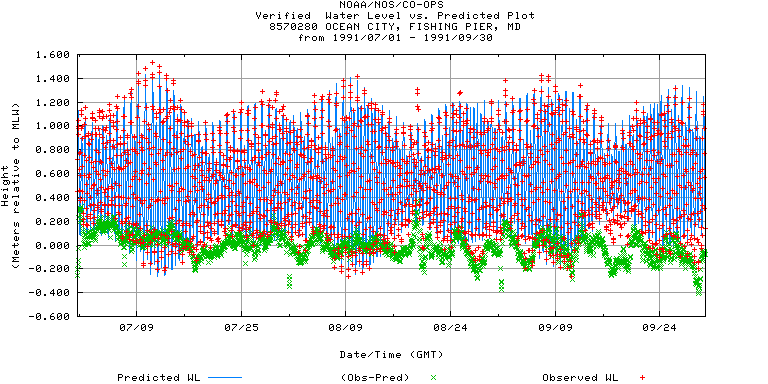
Daily high and low observed data compared with predicted tide height
Datum is mean low water (MLW)
Heights in meters
Green symbols are deviation (+) or (-) from predicted tide height
The datum and mean values for the two sites (Inlet and Pier) are different,
and these differences, especially the mean tide range (MN), affect the
character
of the records. Specifically, more events from the Pier records
approach or
exceed 1.5 m above mean low water, although they generally are within 0.5
m
of the predicted tide height.
|
Datum |
Inlet |
Pier |
Diff. |
Description |
|
MHW |
3.138 |
2.359 |
0.779 |
Mean High Water |
|
MTL |
2.805 |
1.847 |
0.958 |
Mean Tide Level |
|
MSL |
2.829 |
1.853 |
0.976 |
Mean Sea Level |
|
MLW |
2.472 |
1.334 |
1.138 |
Mean Low Water |
|
MN |
0.667 |
1.024 |
-0.357 |
Mean Range of Tide |
|
|
|
|
|
|
|
Max |
4.301 |
3.502 |
0.799 |
Highest Water Level on Station Datum |
|
Min |
1.772 |
0.323 |
1.449 |
Lowest Water Level on Station Datum |
Historic tide records from Ocean City Fishing Pier, Maryland
Click on thumbnail image to view full size, use Back arrow on your browser to return
1990 Jul-Sep
1990 Oct-Dec
1991 Jan-Mar
1991 Apr-Jun
1991 Jul-Sep
1991 Oct-Dec